

After January’s impressive rally, Bitcoin appears to be taking a breather in February. This is a positive sign because vertical rallies are rarely sustained. A small drop can offer long-term investors an opportunity to add to their positions. The asset has gradually corrected since hitting $24,255 on February 2nd. This indicates that short-term traders are making gains. BTC is down by almost 3% while the global volume is up 27%. Bitcoin’s market capitalization dominance is at 41.51%.
At the time of writing, BTC was trading at $22,785.
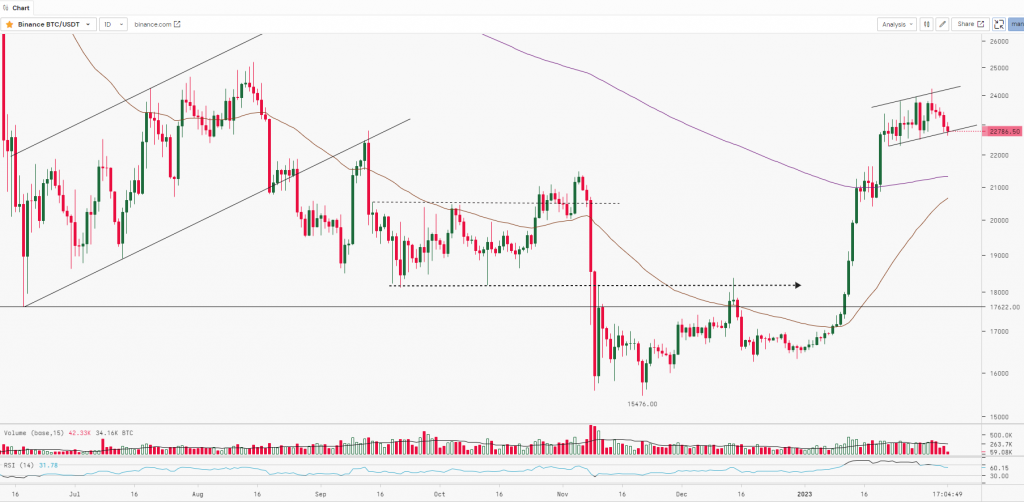
BTC after making the low of $15,476 started trading in a range between $16,000 to $17,500. The asset finally gave a breakout above the range and started moving upwards forming a ‘Higher High Higher Low’ pattern and rallied up to $24,255. Post this move, BTC started consolidating in a ‘Rising Channel’ pattern where the upper sloping line is acting as a resistance and the lower sloping line of the channel is acting as a support. Breakouts on either side of the channel with good volumes will further decide the trend for the asset.
Key Levels:
| Support 2 | Support 1 | Asset | Resistance 1 | Resistance 2. |
| $17,500 | $21,500 | BTC | $25,250 | $28,500 |

