What Are Candlestick Charts?
A crypto candlestick chart visually depicts the trading activity of a specific crypto asset. These charts are rich in detail, presenting data such as the asset’s opening and closing prices, its highest and lowest points, and its price fluctuations over short and long periods. Each candlestick within the chart signifies a distinct price movement, showcasing the asset’s opening, closing, highest, and lowest prices during a specified timeframe. Unlike traditional stock markets, where opening and closing prices typically denote the start and end of a trading day, crypto markets operate 24/7. Therefore, these references encompass the beginning and end of specific time intervals within the continuous trading cycle.
Arranged sequentially, candlesticks form a historical representation of price movements for crypto. Utilizing a crypto candlestick chart is invaluable for market analysis, offering insights applicable to any trading environment, including the dynamic realm of crypto. However, due to the wealth of information they contain, these charts can seem overwhelming. In this article, we delve into the intricacies of crypto candlestick charts, exploring their essential components, various types, and how to interpret them effectively, empowering you to incorporate them into your crypto trading strategy.
Anatomy of a Candlestick
A candlestick chart comprises two primary components: the body and the wick.
The body, depicted as a thicker bar within the candlestick, represents the opening and closing prices of the asset under observation. Typically, in chart displays, a green body signifies a price rise during the designated time frame, whereas a red body indicates a price decline.
On the other hand, the wick, a slender line extending from the body, denotes the highest and lowest price levels recorded within the given period. In most chart setups, the color of the wick aligns with that of the body.
How do I Read Candlestick Charts?
Candlesticks are arranged in chronological order, offering insights into overall trends and identifying resistance and support levels, even without technical indicators. Additionally, they can reveal specific patterns that serve as signals to buy or sell. Given the high volatility of crypto, detailed technical analysis using candlestick charts is particularly pertinent.
The Body
Let’s delve into the candlesticks themselves. Each chart is composed of numerous distinct green or red bars, known as candles or real bodies. Each candle represents a predefined time interval, such as five minutes, an hour, or a day. Understanding the timeframe represented by each candle is crucial, especially for day traders seeking intraday profits. The real body of each candle provides vital information, with its top and bottom indicating the asset’s opening and closing prices within the given timeframe.
The Colour
Determining which end of the candle signifies the opening and closing prices, thus executing bullish or bearish price action, relies on the candle’s color. A green candle signifies a price increase during the specified timeframe, with its bottom denoting the opening price and its top representing the closing price—a bullish signal. Conversely, a red candle indicates a price decrease over the period, with its top representing the opening price and its bottom the closing price—a bearish signal, suggestive of selling pressure.
The Wick
The thin lines above and below the candle’s body, known as the wick, tail, or shadow, show the highest and lowest prices attained during the given timeframe. While an asset may have opened and closed at certain prices, the wick reveals the full extent of its trading range during that period. For instance, despite opening at $50 and closing at $70, the asset may have reached a maximum of $90 and a minimum of $40 within the same timeframe. Thus, the wick provides a comprehensive view of the asset’s trading activity.
Types of Candlestick Patterns

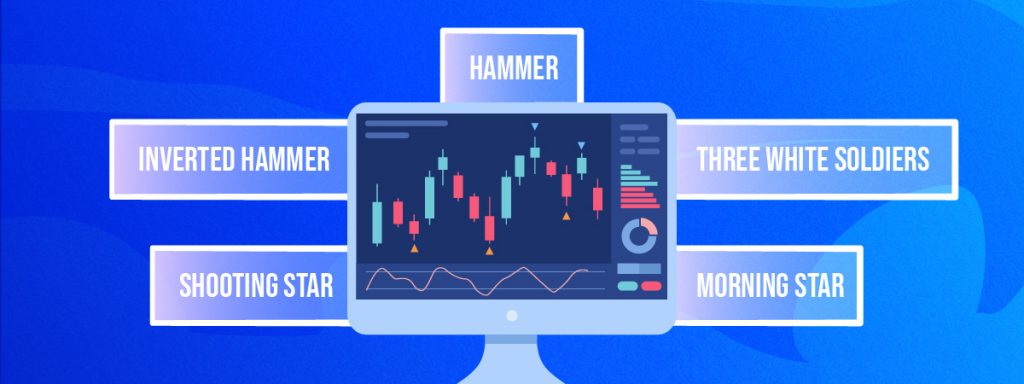
Various candlestick patterns exist, with some of the key ones outlined below.
Hammer
The hammer candlestick features a short body accompanied by a notably longer lower shadow, resembling the shape of an upright hammer. Typically found at the bottom of a downtrend, this pattern signifies resistance from bulls against selling pressure, resulting in a price rebound. While both green and red hammers can occur, green ones suggest a stronger uptrend.
Inverted Hammer
Similar to the standard hammer pattern, the inverted hammer exhibits a much longer upper shadow and a short lower wick. This pattern indicates initial buying pressure followed by unsuccessful attempts by bears to lower the price. Consequently, buyers return with increased pressure, propelling prices upward.
Shooting Star
Characterized by a lengthy top wick, minimal or absent bottom wick, and a small body, ideally situated near the bottom, the shooting star resembles an inverted hammer but appears after an uptrend. It suggests a market peak followed by a takeover from sellers, resulting in a price decline. Some traders prefer confirmation from subsequent candlesticks before acting on this pattern.
Morning Star
Comprising three candlesticks—a long red one, followed by a short-bodied candle, and finally a long green candle—the morning star pattern indicates diminishing selling pressure from the initial period and the emergence of a bullish market trend.
Three White Soldiers
Consisting of three consecutive green candlesticks, each opening within the previous candle’s body and closing above its height, the three white soldiers’ pattern reflects sustained buying pressure, propelling prices higher. The absence of long lower wicks is indicative of this continuous upward momentum. The size of the candlesticks and the length of their wicks can provide insights into potential continuation or retracement trends.
Read more: Crypto Technical Analysis For Beginners
Conclusion
Using candlestick charts can serve as a valuable starting point in your crypto trading journey, enabling you to gauge the potential for price fluctuations. Each candlestick pattern offers insights into short-term market sentiment and decision-making processes. As candlesticks are among the simplest indicators to interpret, they can provide deeper insights into price movements, particularly when used alongside other technical analysis tools.
However, it is crucial to remember that candlesticks alone should not dictate your trading decisions, regardless of your level of experience in crypto trading, especially when dealing with larger trading volumes. Candlestick patterns do not guarantee future price movements, and there have been numerous occasions when the market has defied the expected direction indicated by these patterns.
Nevertheless, candlestick patterns should be part of every crypto trader’s toolkit, including those engaged in day trading, as they exhibit similar efficacy to those in stock markets. While they can offer valuable individual trading signals, we recommend combining these patterns with other technical analysis indicators to either confirm or refute their significance.
Read more: Can Chart Patterns Help with Crypto Trading
If you found this blog to be useful, do share it with other like-minded crypto enthusiasts. Click on the button below to begin your crypto trading journey using ZebPay.


