

After topping the $17,000 mark, Bitcoin once more slipped beneath this key level. Dogecoin plunged the most by 6%, accompanied by a 4% drop in Solana and XRP. BNB additionally tumbled by 3%. The international crypto market cap is currently at $851 billion with a reduction in buying and selling. The general buying and selling tanked over 12% to $42.66 Billion.
BTC has stalled below the $18,600 resistance for the past 19 days, and while the bears successfully broke the $16,000 support on Nov. 21, the 8% range for a 60 % annualized volatility is quite tight. This gives investors good reason to doubt that the BTC price will maintain its current gains before the $430 BTC option expires on December 2nd. Ignored weakness in US stock markets intends to start recovery on November 30th. Buyers attempt to close the month above $17,000. This suggests that selling, which had picked up due to the FTX crisis, may be slowing down. Normally, retail investors panic and dump their holdings in a bear market, but for Bitcoin investors, the opposite is the case. According to Glassnode data released Nov. 27, investors holding less than one bitcoin, also known as shrimp, have bought 96,200 bitcoin since the FTX crash. Similarly, investors who have held between 1 and 10 bitcoin, classified as crab, have bought 191,600 bitcoin in the last 30 days. This shows that investors continue to accumulate at lower levels.
ETH turned down from the 20-day EMA of $1,234 on November 26, but the bulls halted the decline on November 28 at $1,151. This signals a pick-up in demand and a sign that sentiment could be turning positive. To invalidate this bullish view, the bears need to defend the 50-day SMA and sink the price below $1051. The pair could then drop to the channel’s support line. Derivatives traders remain bearish as the Ether futures premium is negative. On November 29, however, it showed at least a modest improvement. The bears may highlight how far we are from a 0%-4% neutral premium to a bullish premium, but the fallout from a 71% drop in one year weighs heavily.
Currently, the FOMC expects a 25-50 basis point increase in December, not the usual 75 basis points, according to CME Group’s Fed Watch tool. The US Dollar Index (DXY) recently hit its highest level since 2002 and momentum may have cooled thereafter. Recent CPI and PPI releases showed that the Fed has made some progress on runaway inflation. Ideally, investors would see a falling DXY as a reason to boost confidence in risky assets like crypto. Historically, a cooldown in the DXY is followed by bitcoin price movement in the opposite direction.
Overall, crypto markets are likely to continue seeing price volatility, and most analysts agree that there are still many volatile days ahead. While the positive news about rate cuts makes for a nice near-term spike in crypto prices, Powell’s final decision on December 1st will be the real determinant of the direction the market will take.
Technical Outlook:
BITCOIN:
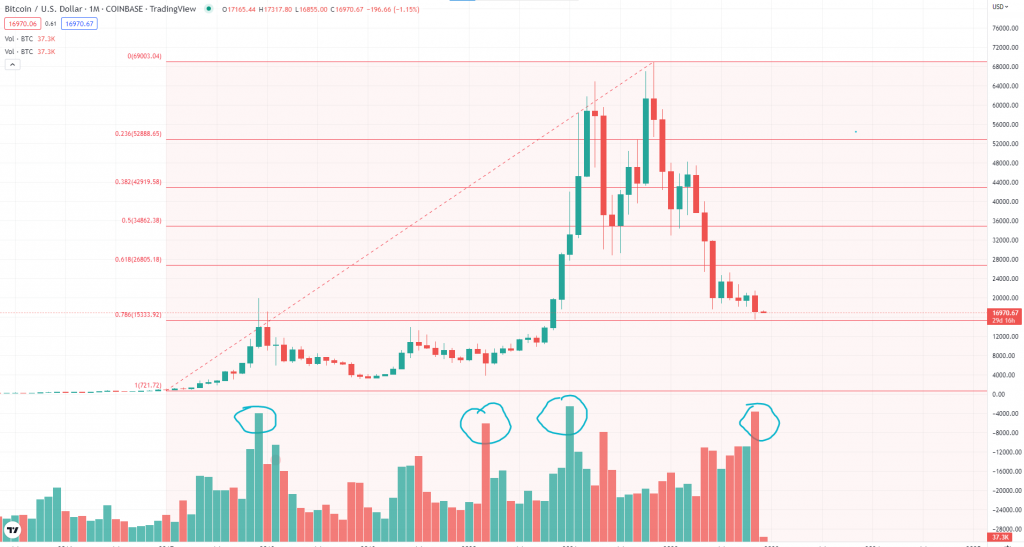
BTC last month broke the long-held support of $17,500 and made the monthly low of $15,460. Post this move, the asset has been consolidating and trading sideways with low volumes. Last week, the prices went above $17k but the bulls failed to push the prices above the key level of $17,500. Technically, on a monthly time frame, BTC is taking support around $15,350 (78.6% Fibonacci Retracement Level). If it breaks and closes below this support then we can expect more downfall and it can further drop to $12,000. To witness a rally it needs to break and close above $17,500.
ETH:
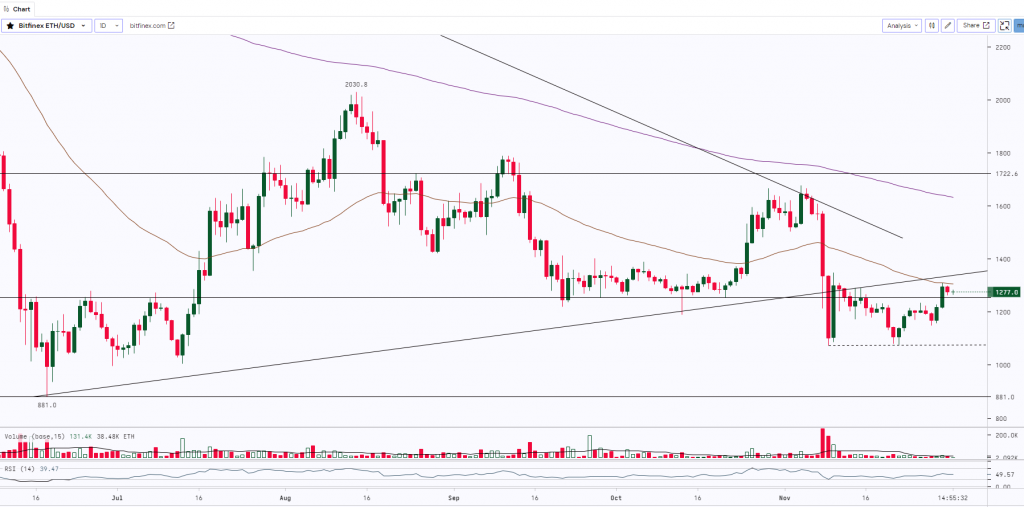
ETH after resisting the downsloping trendline, corrected almost by 36% and made the low of $1,073.9. Post this move, the asset has been trading in a broad range from $1,080 to $1,300 with low volumes. Breakouts on either side of the range with good volumes will further decide the trend for the asset. To witness a rally ETH needs to break and close above $1,400 whereas $1,000 will act as a strong resistance.
BNB:
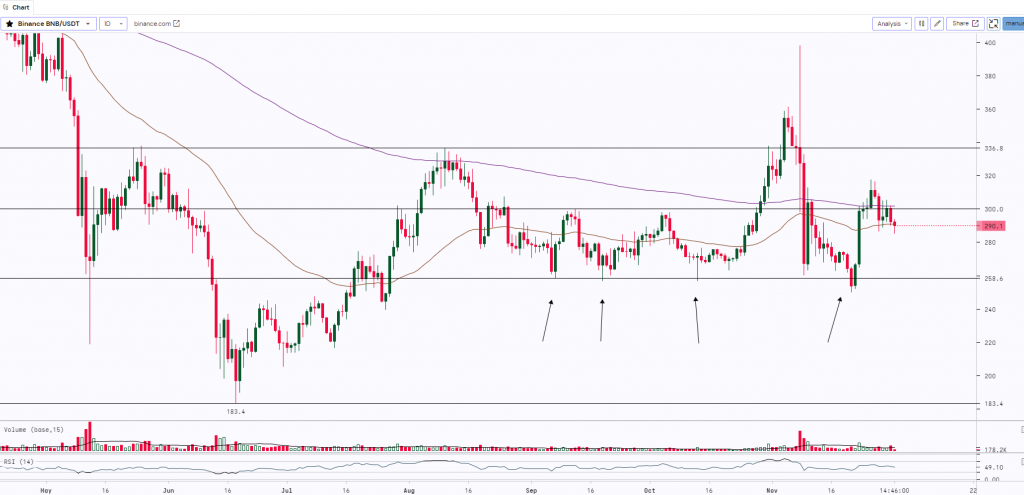
BNB was very volatile last month. The asset was trading in a range from $250 to $300. It finally gave a breakout above the range and made the high of $398.3. However, the bulls failed to manage their grip on the asset and it witnessed a sharp correction from its highs and dropped back to $250. Currently, BNB is trading at around $300. If it sustains above $300 then we can expect the prices to further rally up to $336 and $380 levels.
Monthly Snapshot:
| October | November | Current Month | Current Month | ||||
| Close | Close | % Change | High | Low | High | Low | |
| BTC | $20,285 | $17,169 | -15.36% | $20,938 | $18,320 | $21,447 | $15,599 |
| ETH | $1,514 | $1,296 | -14.43% | $1,585 | $1,209 | $1,661 | $1,081 |
| BNB | $286.84 | $300.79 | 4.86% | $293.07 | $264.52 | $316.96 | $286.14 |
| crypto | 1m – % Vol. Change (Global) |
| BitCoin (BTC) | 27.91% |
| Ethereum (ETH) | 18.53% |
| Binance Coin (BNB) | 106.16% |
| Resistance 2 | $22,500 | $1,750 | $1.20 | $335 |
|---|---|---|---|---|
| Resistance 1 | $17,500 | $1,400 | $1.00 | $300 |
| USD | BTC | ETH | Matic | BNB |
| Support 1 | $15,500 | $1,000 | $0.75 | $255 |
| Support 2 | $12,000 | $880 | $0.63 | $215 |
Market Updates:
- 26% capital gains tax will be imposed on crypto trading profits larger than 2,000 euros ($2,062) in Italy. It is planning to tighten regulations on digital assets in 2023 by expanding its tax laws to include crypto trading
- BNB Chain-based decentralized finance (Defi) protocol Ankr has confirmed that it has been hit by a multi-million dollar exploit on Dec 1st. The decentralized-finance protocol said it is working with exchanges to immediately halt trading of its BNB staking rewards token, aBNBc
- Fantom seeks to implement an affiliate program for its decentralized application. To fund this venture, the Fantom community has proposed slashing the protocol’s current FTM token burn rate from 20% to 5%
- The Japanese subsidiary of the now-defunct FTX crypto exchange has come out with a roadmap to resume withdrawals, after confirming that its customers’ assets are not part of FTX’s bankruptcy proceedings
Disclaimer: This report is not intended to be relied upon as advice to investors or potential investors and does not take into account the investment objectives, financial situation, or needs of any investor. All investors should consider such factors in consultation with a professional advisor of their choosing when deciding if an investment is appropriate. The Company has prepared this report based on information available to it, including information derived from public sources that have not been independently verified. No representation or warranty, express or implied, is provided in relation to the fairness, accuracy, correctness, completeness, or reliability of the information, opinions, or conclusions expressed herein. This report is preliminary and subject to change; the Company undertakes no obligation to update or revise the reports to reflect events or circumstances that arise after the date made or to reflect the occurrence of unanticipated events. Trading & Investments in cryptos viz. Bitcoin, Bitcoin Cash, Ethereum, etc are very speculative and are subject to market risks. The analysis by the Author is for informational purposes only and should not be treated as investment advice.

