

BITCOIN, the largest crypto asset by market cap, has been trading in an uptrend as the prices have risen almost by 26% over the past seven days. The current market cap is $406,795,758,726 up by 1.85% over the past 24 hours and the current market dominance of BTC is at 40.98%.
At the time of writing, BTC was trading at $21,146.
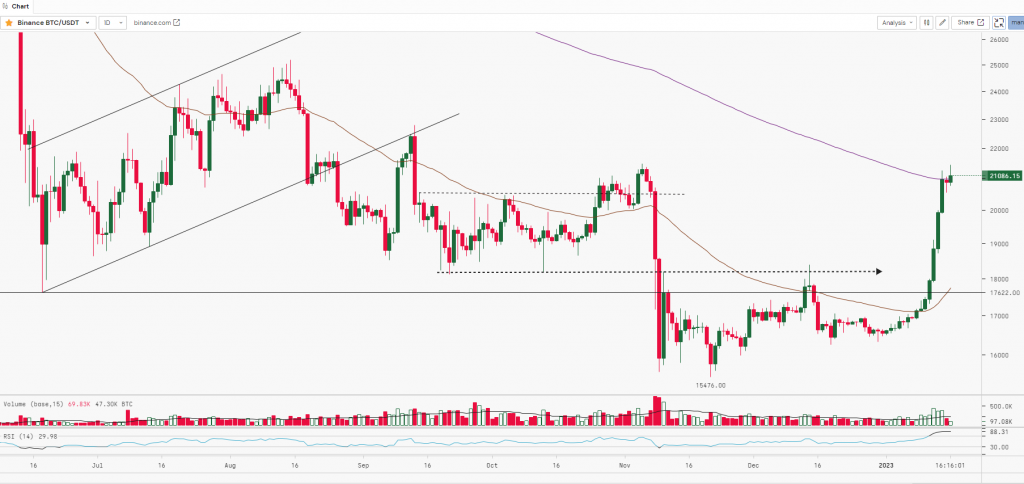
BTC was trading in a range from $15,500 to $17,500. After giving a breakout above the range, the prices witnessed a rally and made the high of $21,439 by forming a ‘Higher High Higher Low’ pattern. BTC has strong resistance at $22,500 and we can expect some profit booking around these levels. RSI at 88 indicates that the asset is in an overbought zone. Once BTC breaks, closes and sustains above $22,500 then we can expect it to further rally up to $28,500. $17,500 and $15,000 will act as strong support for the asset.
Key Levels:
| Support 2 | Support 1 | Asset | Resistance 1 | Resistance 2. |
| $15,000 | $17,500 | BTC | $22,500 | $28,500 |

