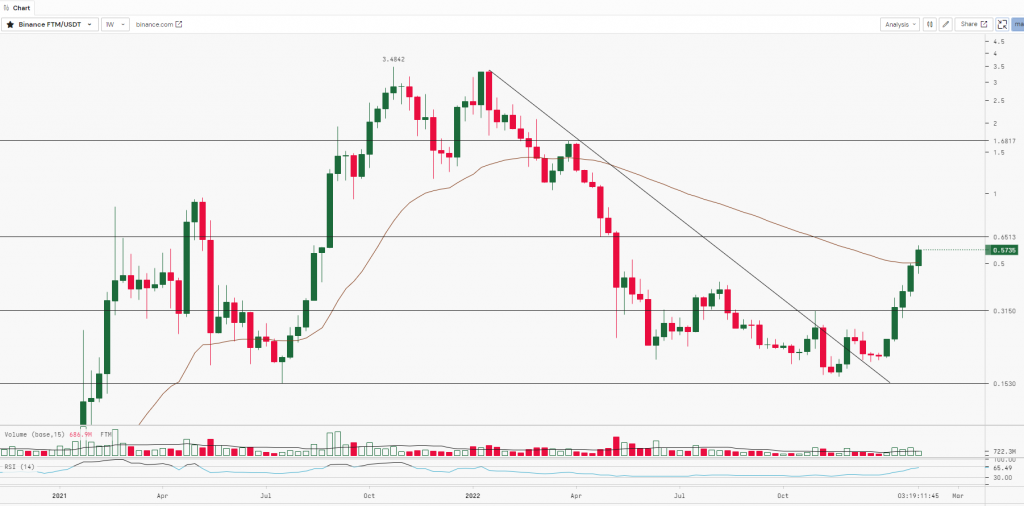
FTM has been on a great run since breaking above the line. The recent strong rally suggests aggressive buying by the bulls. Indicators are showing that the bulls are firmly in control. During strong up moves, corrections are short-lived as bulls buy every small dip. The bears are attempting to halt the bullish move near the psychological resistance, but if the bulls break this level, the FTM/USDT pair could shoot higher. The asset is up by almost 9% while the global volume has fallen by 14% in the last 24 hours.
Read more: What is Fantom (FTM)
At the time of writing, FTM was trading at $0.572

FTM after taking support at $0.155 (Horizontal Trendline) showed signs of recovery and went up to $0.262. The asset was resisting at $0.27 and witnessed some profit booking and dropped to $0.19 levels. Post this move, FTM made a ‘Double Doji’ candle and started moving upwards by forming a ‘Higher Top Higher Bottom’ pattern and surged almost by 210% up to $0.5992. The asset is trading in the green for the fifth straight week. FTM has a strong resistance zone from $0.6 to $0.65. Hence, to further rally it needs to break, close and sustain above the resistance level.
| Support 2 | Support 1 | Asset | Resistance 1 | Resistance 2 |
| $0.3 | $0.45 | FTM | $0.65 | $0.87 |

