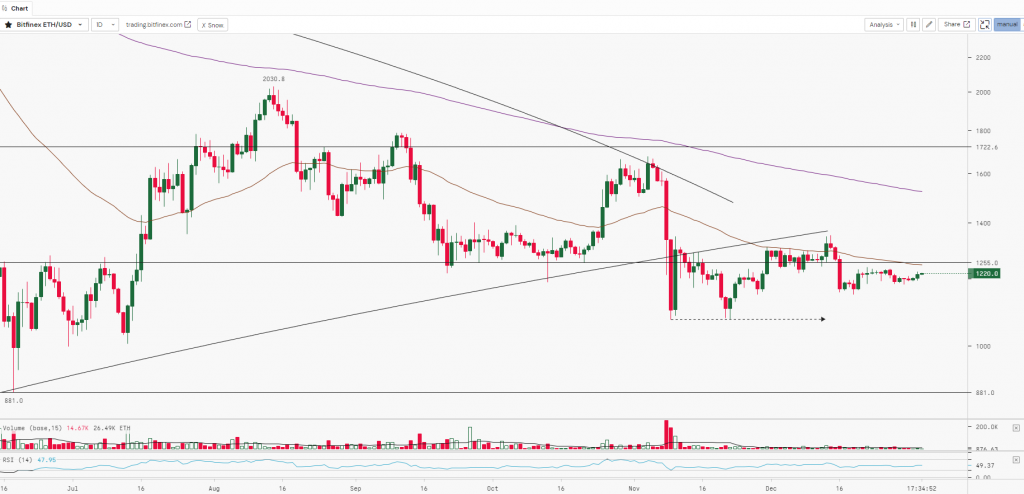
The U.S. Dollar Index (DXY), whose normal movements are in inverse correlation with Bitcoin, can be seen to have topped out. This will increase the probability of crypto forming a bottom. The bulls did not have the power to push Ether above the Moving averages in the past few days. However, an encouraging signal is that they’ve now no longer ceded the floor to the bears. This indicates that the bulls will make one greater try and propel the price above the Moving Average. The asset price has increased marginally by 1.32% while the global volume is up by almost 50%.
At the time of writing, ETH was trading at $1,220.

ETH continues to hover around $1,200 with low volumes. The asset was trading sideways last month in a range from $1,350 to $1,150. Flat Moving Averages, RSI at 50 and low volumes indicate more sideways movement. ETH has a strong resistance zone from $1,350 to $1,400. Once the prices close and sustain above these levels then we can expect a rally. $1,150 and $1,000 will act as strong support, a break below the support will lead to a downfall.
| Support 2 | Support 1 | Asset | Resistance 1 | Resistance 2 |
| $880 | $1,000 | ETH | $1,400 | $1,750 |

