


ETH remains sandwiched between the 20-day EMA ($1,591) and the overhead resistance at $1,680. This range-bound trading is unlikely to last long and a breakout could occur soon. The asset price has fallen by a marginal percentage of 0.31% while the global volume has gone down by almost 11%. The rising US dollar has held back bitcoin price recovery, but lower levels should attract buyers of ETH and other altcoins.
At the time of writing, ETH was trading at $1,634
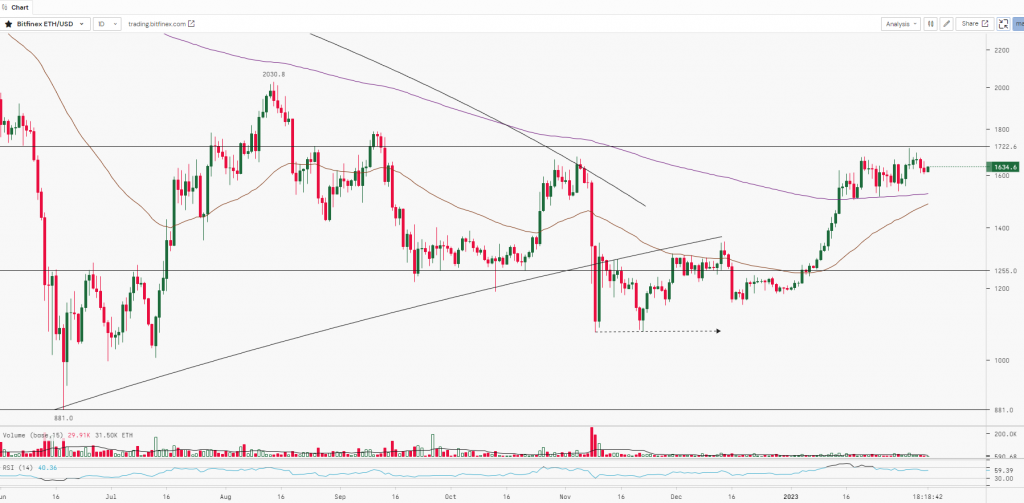
ETH, after giving a breakout above the range ($1,100 to $1,250), surged almost by 36% and made a high of $1,714.6. The bulls are struggling to break the key resistance zone at $1,700-$1,750 (Horizontal Trendline) and the upper shadows around these levels indicate profit booking or indecision in trend. Currently, the asset is consolidating and trading between $1,700 to $1,550 and is taking good support around $1,500 at its 200-Day Moving Average. Breakouts on either side of these levels with good volumes will further decide the trend for ETH.
| Support 2 | Support 1 | Asset | Resistance 1 | Resistance 2 |
| $1,250 | $1,500 | ETH | $1,750 | $2,000 |

