
Here is a technical analysis of ETH/USDT on a daily timeframe:
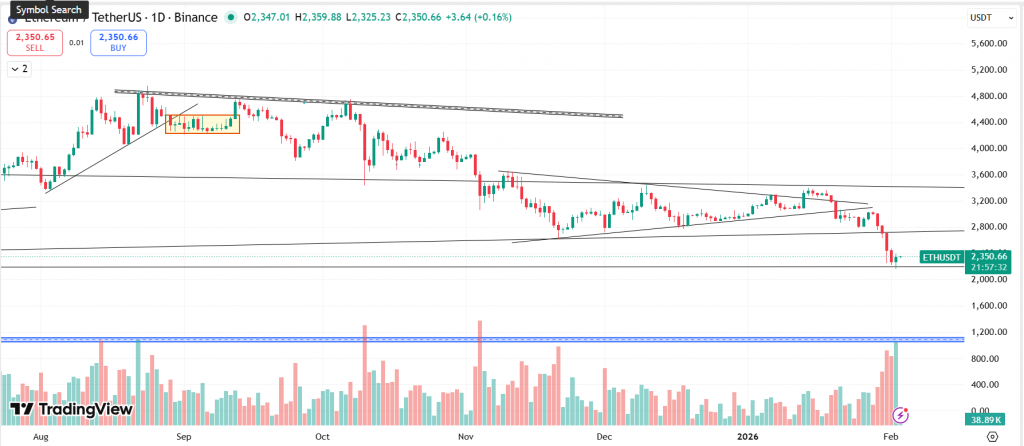
Market Structure: ETHUSDT remains in a clear daily downtrend, with consistent lower highs and lower lows since the macro top, and the long-term descending trendline continues to act as strong resistance.
Pattern Breakdown: The breakdown of the symmetrical triangle pattern was a bearish continuation signal and has broken decisively to the downside, confirming trend continuation rather than a reversal.
Volume & Momentum: The breakdown occurred with expanding sell volume, indicating real distribution. Momentum is weak, no bullish divergence is present, and strong red candles confirm active sellers.
Key Levels: Price is now below prior structural support, which is likely to act as resistance on pullbacks, while the 2,200 level stands out as a major multi-year support drawn from December 2023.
Also Read: Crypto at WEF 2026: A Defining Moment for Global Finance
Risk Zone: A clean break below 2,200 could open downside toward the 1,800 region, and any major move up or down should be validated by clear volume expansion.
At the time of writing, ETH was trading at $2,350.
Here is the chart with a broader view:
Summary: ETH is still trending bearish on the daily, with price respecting a long-term downtrend and the recent breakdown backed by strong selling pressure, signaling continuation rather than any meaningful reversal. Price is now below key structure, making 2,200 a crucial support to watch, as a loss of this level could accelerate downside toward the 1,800 region, especially if volume expands.
Key Levels
| Support 2 | Support 1 | Asset | Resistance 1 | Resistance 2 |
| $1,800 | $2,200 | ETH | $2,800 | $3,100 |
In the grand scheme of things, ZebPay blogs are here to provide you with crypto wisdom. Get started today and join 6 million+ registered users to explore endless features on ZebPay!