

Bitcoin briefly erased its year-to-date gains after a sharp weekend sell-off, even though the U.S. government’s reopening on Thursday was expected to stabilize markets. The crypto asset fell to $93,029, slipping below its $93,507 yearly open and retreating 25% from its October peak, before recovering to around $94,209. While regulatory progress and growing corporate adoption under the Trump administration have boosted long-term sentiment, macro pressures — including tariff tensions and the record 43-day shutdown — continue to weigh on prices. Whale selling has also contributed to the downturn, though analysts noted last week that the “OG Whales Dumping” narrative is overstated, calling it typical late-bull-market behaviour rather than an unusual threat.
At the time of writing, BTC was trading at $95,048.
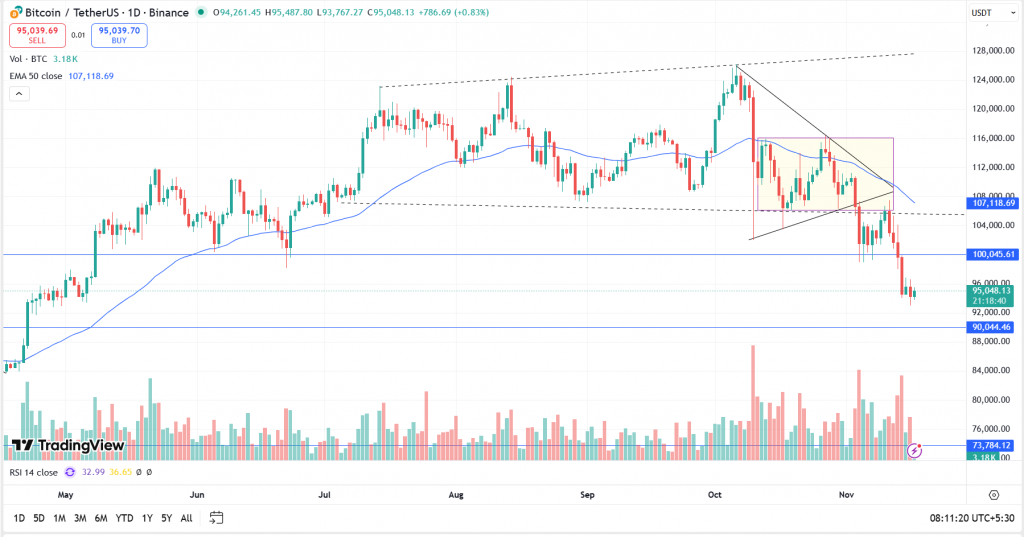
BTC, after making a new all-time high of $126,199, witnessed a sharp fall as the price plunged almost 20% to $102,000. Following this move, the asset traded in a range between $116,000 and $107,000, forming a ‘Symmetrical Triangle’ pattern. BTC gave a breakout below the range and made a low of $93,005. The asset has a strong support zone between $92,000 and $90,000. If it holds and sustains above this support, we may see some recovery, whereas a break and close below it could lead to further downside.
Key Levels:
| Support 2 | Support 1 | Asset | Resistance 1 | Resistance 2. |
| $83,000 | $90,000 | BTC | $100,000 | $107,000 |
Unravel everything that you need for your crypto journey via ZebPay blogs. Get started today and join 6 million+ registered users on ZebPay!