

Bitcoin hovered around $105,500 as the June 8 weekly close approached, signaling renewed optimism that the recent correction may have run its course. After dipping to $100,500 on June 5, BTC/USD has staged a solid recovery, inching back toward its weekly opening levels. This rebound has reignited bullish sentiment among traders, many of whom believe the broader uptrend is resuming. Analysts are drawing parallels between Bitcoin’s current market structure and gold’s legendary breakout in the early 2000s. If history repeats itself, they argue, Bitcoin could follow a similar trajectory — with the $150,000 target once again looking achievable.
At the time of writing, BTC was trading at $105,550.
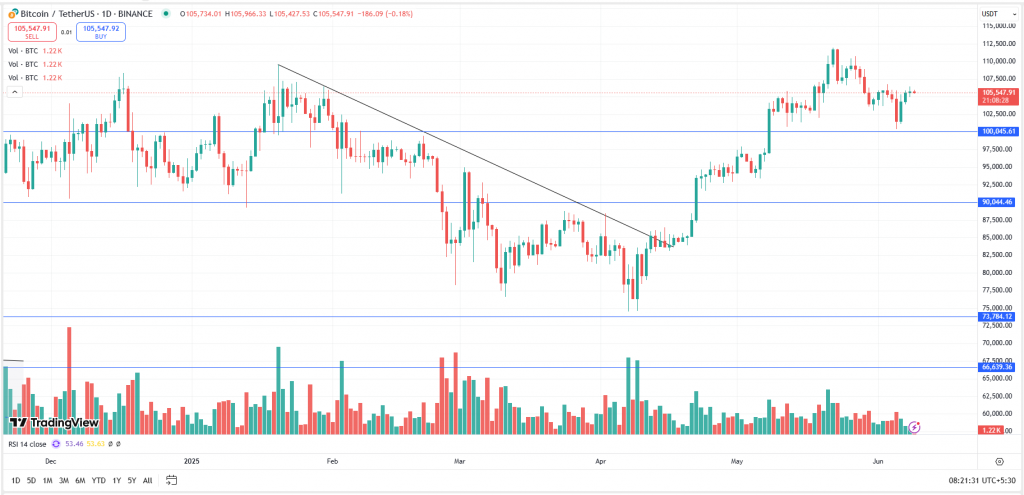
BTC, after making the all-time high of $111,980, witnessed a minor correction, and the price fell almost 10.25%, dropping to $100,372. However, the bears failed to break the key and psychological support level of $100,000 and rebounded to $105K, but with declining volumes. The asset has strong support at $100K and $90K, whereas to further rally, it has to break, close, and sustain above the all-time high of $111,980.
Key Levels:
| Support 2 | Support 1 | Asset | Resistance 1 | Resistance 2. |
| $90,000 | $100,000 | BTC | $110,000 | $125,000 |
Unravel everything that you need for your crypto journey via ZebPay blogs. Get started today and join 6 million+ registered users on ZebPay!