


Bitcoin’s hopes for an immediate rebound faded as the crypto extended its decline to February 5, following a highly volatile weekly open that saw price swings of nearly $11,000 in a single day. For the second time since January 15, BTC’s daily chart closed below $100,000, signaling potential consolidation in the days ahead as traders reassess market conditions. Following the widespread liquidations, investors anticipated a cooling-off phase, using the opportunity to reposition and evaluate the likelihood of further downside.
Conversely, fresh data revealed that whale addresses accumulated over 30,000 BTC during the recent dip, a move that often precedes a short-term rebound. If Bitcoin manages to close above $100,000, it could invalidate the current bearish trend and temporarily shift momentum in favor of the bulls.
BTC-USDT Daily Chart:
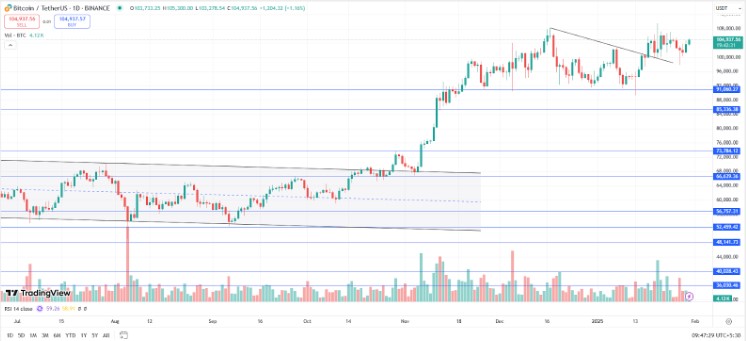
BTC made an ‘Evening Star’ pattern at $108,353, and the prices corrected almost by 17.5%, dropping to $89,256. The asset faced multiple support levels at $90,000 and the lower longer shadow around 90K indicated buying at these levels. BTC resumed the upward movement and made a new all-time high of $109,588 last week. Post this move, the asset is consolidating between $100,000 and $107,000. BTC has strong support at $99,000 and $85,000, whereas $110,000 will act as a strong resistance.
Keep yourself ahead of the crypto curve with ZebPay blogs—click the button below and join 6 million+ users who trust ZebPay for their trading needs!