


Here is a technical analysis of ETH/USDT on the daily timeframe.
Chart Structure:
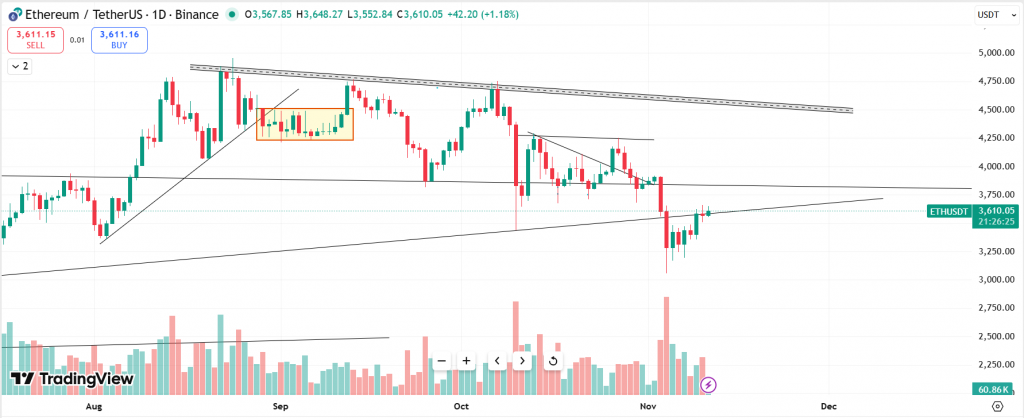
ETH/USDT is trading within a narrowing range. After the sharp early-November sell-off, the price stabilized near the $3,600 region and has since shown a mild recovery. However, the overall structure still reflects a medium-term downtrend, with ETH yet to reclaim the major descending resistance line from the August highs.
At present, ETH is trading around $3,610, hovering near the midpoint of its short-term range. The recent bounce from the $3,600 support suggests temporary buying interest, but the lack of strong follow-through volume indicates a cautious market tone. A decisive breakout above $3,900 would confirm a bullish continuation, while a breakdown below $3,300 could resume the broader downtrend.
At the time of writing, ETH was trading at $3,610.
Summary:
ETH remains in a critical decision zone. The consolidation between $3,600 and $3,900 suggests that the next move could be sharp. If ETH breaks above $3,900 with strong volume, expect a run toward $4,400–$4,500.
If ETH breaks below $3,250–$3,300, the medium-term downtrend is likely to resume, with targets potentially dipping toward $2,700–$3,000.
Key Levels:
| Support 2 | Support 1 | Asset | Resistance 1 | Resistance 2 |
| $3,300 | $3,600 | ETH | $3,900 | $4,250 |
Unravel everything that you need for your crypto journey via ZebPay blogs. Get started today and join 6 million+ registered users on ZebPay!