


Ethereum faced a sharp pullback on Friday after being rejected near the $2,724 resistance level, registering a 5.12% decline. Over the weekend, the price found support at the 200-day moving average, stabilizing around $2,447. Despite the dip, the Relative Strength Index (RSI) remains at 64—comfortably below the overbought threshold of 70—suggesting there’s still room for bullish momentum if buyers regain control. However, caution is warranted, as the MACD flashed a bearish crossover on Friday, signaling potential short-term weakness and a possible continuation of the downward move. Traders will likely keep a close eye on these technical levels for confirmation of the next trend direction.
At the time of writing, ETH was trading at $2,550.
(Also Read: Bitcoin Price Hits All-Time High: What It Means for Crypto Investors?)
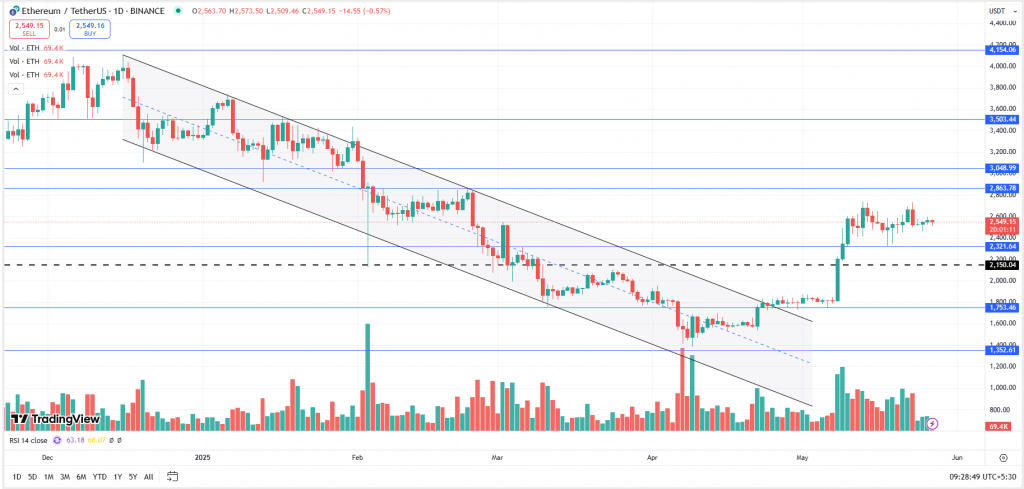
ETH, after breaking the ‘Descending Channel’ pattern, started consolidating in a range from $1,875 to $1,775. The asset finally gave a breakout above the range and witnessed a massive rally. The price surged almost 97% from the recent lows of $1,385 to $2,738. Post this move, ETH saw some profit booking, and the price dropped almost 15% to $2,323. The asset bounced from $2,323 but was not able to break the recent high of $2,738. ETH is facing strong resistance at $2,750. If it breaks and closes above this level with good volumes, then we can expect the price to further rally up to $3,000 and $3,350.
Key Levels:
| Support 2 | Support 1 | Asset | Resistance 1 | Resistance 2 |
| $2,150 | $2,350 | ETH | $2,750 | $3,000 |
Unravel everything that you need for your crypto journey via ZebPay blogs. Get started today and join 6 million+ registered users on ZebPay!