

Here is a technical analysis of ETH/USDT on a daily timeframe:
Chart Structure: The price is trading below key trendlines — both the descending resistance and the longer-term diagonal support. A range-bound consolidation was visible in September (highlighted in orange), after which the price attempted several breakouts but failed to sustain above the resistance lines.
Current Position: ETH has broken below the local support zone and is now retesting the next longer-term uptrend line (currently acting as support). Volatility and volume spiked during the recent sell-off, suggesting panic selling.
Resistance and Support Levels:
- Resistance 1: $3,800–$3,900 region. This aligns with recent local highs and coincides with a major on-chain support area that has repeatedly acted as technical resistance.
- Resistance 2: $4,250–$4,450 zone. This corresponds to the descending trendline and historical supply zone, where the price has repeatedly failed to break above in recent months.
- Support 1: $3,600. This immediate level has just been tested, with the price showing a slight bounce. It also represents a psychological and historical support level.
- Support 2: $3,300–$3,400 region. If $3,600 breaks decisively, this zone marks the next key support derived from summer lows and the broader chart structure.
News & Global Events Impact
- Recent Bearish Move: A major DeFi protocol hack and a substantial $2.6 billion options expiry triggered a sharp fall, briefly pushing ETH below $3,600, with a daily decline exceeding 7%.
- Macro Factors: Despite a Fed rate cut intended to stimulate risk assets, crypto markets corrected after failing to attract sufficient traditional finance inflows, highlighting ongoing investor caution.
- Institutional Flows & Network Health: Q3 2025 saw strong institutional interest, with Ethereum spot ETFs outperforming Bitcoin in inflows. Layer 2 adoption and robust DeFi activity continue to provide fundamental price support.
At the time of writing, ETH was trading at $3,637.
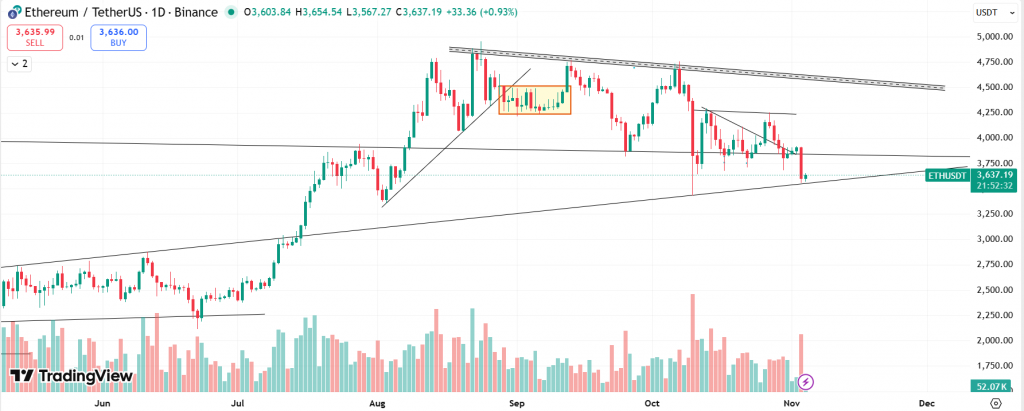
Summary: Ethereum is experiencing heightened volatility following a major DeFi exploit and options expiry, pushing prices toward key support levels. Despite short-term panic, strong on-chain and institutional metrics are maintaining a cautiously optimistic medium-term outlook. The chart indicates solid support at $3,600 and $3,300, with resistance near $3,900 and $4,250. If the current support holds, a seasonal rebound and accumulation phase could fuel a potential year-end rally.
Key Levels:
| Support 2 | Support 1 | Asset | Resistance 1 | Resistance 2 |
| $3,300 | $3,600 | ETH | $3,900 | $4,250 |
Unravel everything that you need for your crypto journey via ZebPay blogs. Get started today and join 6 million+ registered users on ZebPay!