MACD and Bollinger Bands’ strategies can be combined to analyze and provide trading information about crypto markets. The combination of these tools allows for a more detailed analysis of markets, and to predict the future direction of crypto markets movement.
Understanding MACD and Bollinger Bands
MACD is velocity, or momentum, best used as a trend-identification tool. Bollinger Bands are simply a measure of width – a volatility measure – that works best as a ‘band’ or ‘channel’ around a central band, allowing us to see whether prices have risen too high or fallen too low. Then you can build a strategy, in the direction of either trend-following or mean-reversion strategies, depending on where you are in the continuum of greed or fear.
How does MACD work?
The ‘Moving Average Convergence Divergence’ (MACD) indicator, a darling of crypto traders, can help you see the speed and direction of a crypto’s momentum and strength.
There are two aspects of the MACD: the MACD line and an associated signal line. A bull signal is triggered when the MACD line crosses above the signal line; a bear signal is triggered when the MACD line crosses below the signal line. The MACD histogram adds colour to these two lines and depicts the difference or gap between the MACD line and the signal line.
The histogram is also useful because it quickly shows us the strength and direction of the trend. A bullish trend is evident when the MACD is above zero because the histogram rises over zero. A bearish trend is shown when the MACD is below zero; the histogram dips under zero. Growing or shrinking histogram bars show how strong the trend is: the more crowding of the histogram bars, the stronger the trend.
How do Bollinger bands work?
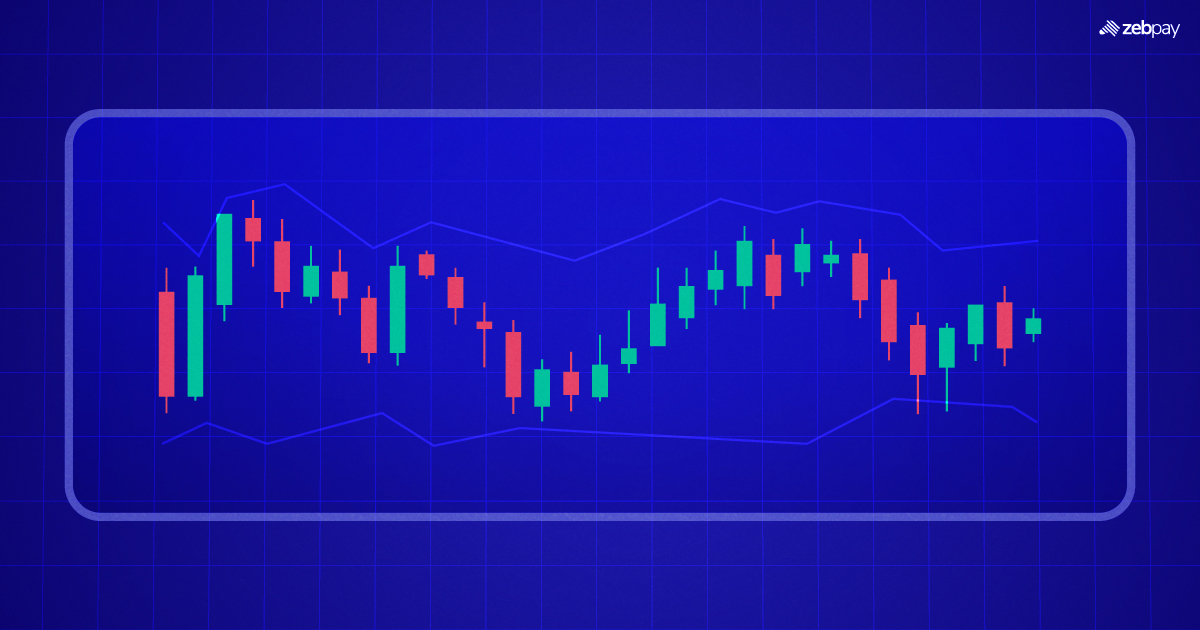
Bollinger Bands (BB) is an effective technical analysis tool that includes three lines, representing the upper band, the middle band (moving average), and the lower band. It provides traders with information regarding market direction, volatility, and trading opportunities, helping them to analyze market conditions over a selected period. Price movements and volatility can be visually represented using Bollinger bands. It has been attested to be an effective technical analysis tool in trading communities, having been created and popularized by the US trader John Bollinger.
Interpreting MACD and Bollinger Bands Together
This system capitalizes on trends by combining the momentum of the MACD indicator with the power of Bollinger Bands to identify price breakouts. Together, these tools can help you assess momentum best, especially if the price breaks out of the Bollinger Bands. Here’s how.
- A buy signal is when the prices move above the upper band, along with the MACD line crossing above the signal line and heading northwards.
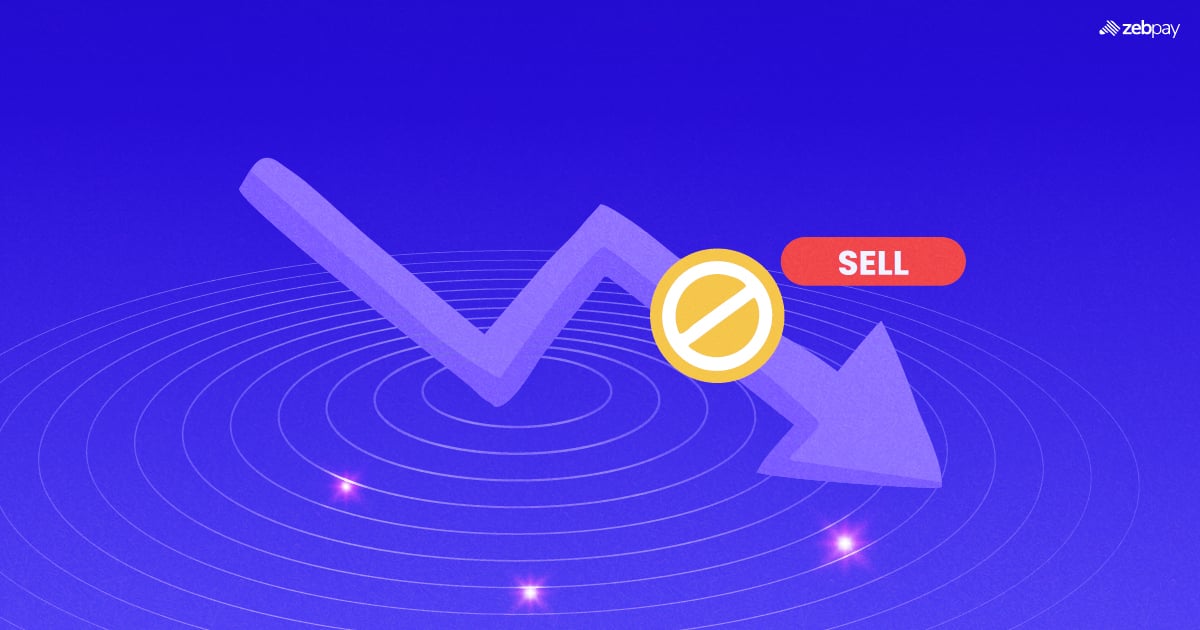
- On the other hand, a sell signal is triggered when prices move below the bottom band and join with the MACD line, which crosses below the signal line and moves downward.
Mean-Reversion Strategy
Those seeking to trade on price reversals can make use of the mean-reversion strategy using MACD and Bollinger Bands. The Bollinger indicator’s upper and lower bands can help estimate price extensions from the mean. Note that the middle band of the Bollinger indicator represents a moving average, and the upper and lower bands are usually 2 standard deviations (SD) away from the middle band. Do the following:
- A long signal is triggered when prices retrace to the lower band and then reverse, with a bullish divergence in the MACD.
- Conversely, when prices touch the upper band and then reverse, resulting in a bearish divergence in the MACD, we get a buying signal. This is known as a rendezvous, a merging on the chart of price and the momentum line.
Combining these indicators will improve the odds of detecting significant market trends and reversals.
How do you use MACD with Bollinger bands?
The MACD is a momentum oscillator that works well with trends, and Bollinger bands are a volatility channel indicator that works well with price extremes concerning their mean. When both of these tools are combined, traders have opportunities to capitalize on momentum and volatility with two tools on one chart.
This could be something like an overextension of prices from the mean, as seen in Bollinger Bands, which might indicate a mean-reversion opportunity, and traders might use a MACD signal such as the MACD line crossing above or below the signal line to identify a potential reversal point.
On the other hand, when BB expands and prices subsequently explode in any direction, especially if a new trend is forming, a trader can confirm this breakout with the MACD indicator. For an upward breakout, watch the fast MACD line cross above the signal and for the fast MACD to continue moving higher to or above the zero level. Meanwhile, for a downward breakout, an observer should watch the fast MACD cross below the signal and for the fast MACD to continue moving lower to or below the zero level.
By combining these measures appropriately, traders make better decisions by more accurately foreseeing turning points and confirming emerging trends.
Conclusion
Both MACD and Bollinger Bands are reputable indicators that can serve as the cornerstone of successful trading strategies on their own. Their efficacy largely depends on how you utilize them in your trading endeavours. To verify their accuracy, it’s crucial to conduct thorough backtesting. However, it’s important to recognize that superior performance in one scenario or market during backtesting doesn’t ensure superiority in all situations. Different parameters and market conditions can significantly influence their effectiveness.
Seasoned traders will use these indicators in many ways, adapting their system to the market scenario. The MACD and Bollinger Bands combination is about identifying the market context where one outperforms the other, which would consequently improve and increase the reliability of the results. The same rule applies when the question is whether traders should trade with algorithms, indicators, or gut feelings; their usefulness depends on how well they respond to the market scenario.
If you found this blog useful, share it with other like-minded crypto enthusiasts. Click on the button below to begin your crypto trading journey using ZebPay.