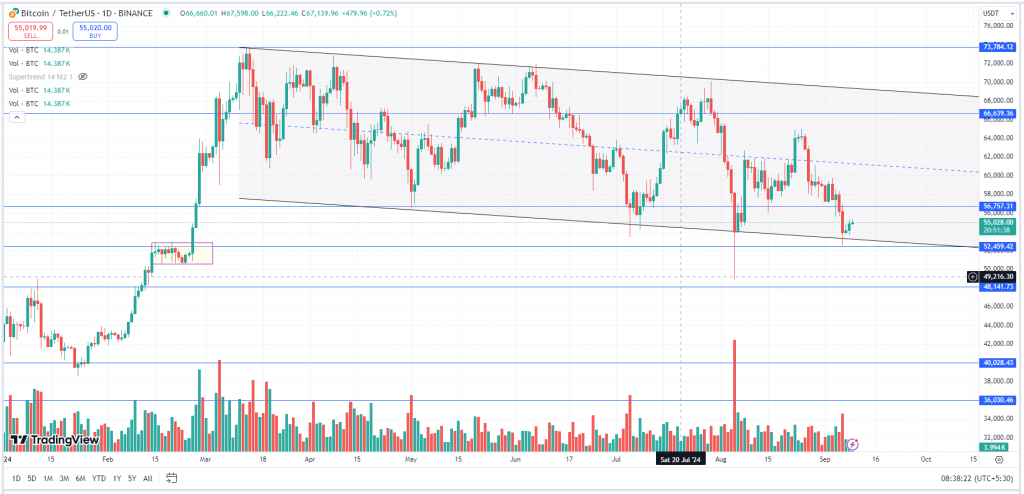
On September 6, Bitcoin broke below its key support range of $55,724 to $73,777, triggering a sharp decline to an intraday low of $49,000, last seen on August 5. The cryptocurrency market experienced a major downturn, with BTC plunging to a one-month low of approximately $53,000, fueling bearish sentiment across the market. This drop led to over $295 million in liquidations, within just 24 hours. Despite the pullback, Bitcoin has since managed to post modest gains, helping the global crypto market cap reclaim the $2 trillion level.
At the time of writing BTC was trading at $55,042.

BTC continues to trade in a ‘Descending channel’ pattern, where the upper downsloping line is acting as the resistance and the loewe downsloping line is the support. The lower longer shadows, around $52,000, indicate buying around these levels. Once BTC gives a breakout above the Descending channel pattern, then we may expect the prices to rally and cross the previous all time high of $73,777. The asset has a strong support zone from $52,000 to $48,00, whereas $56,000 & $62,500 will act as a strong resistance
Key Levels:
| Support 2 | Support 1 | Asset | Resistance 1 | Resistance 2. | |
| $48,000 | $52,000 | BTC | $56,000 | $62,500 |
In the grand scheme of things, ZebPay blogs is here to provide you with crypto wisdom. Click on the button below and discover endless features on ZebPay!


