


As of September 30th, 2025, the daily chart for Ethereum (ETH/USDT) shows significant technical developments, suggesting key areas for traders to watch closely.
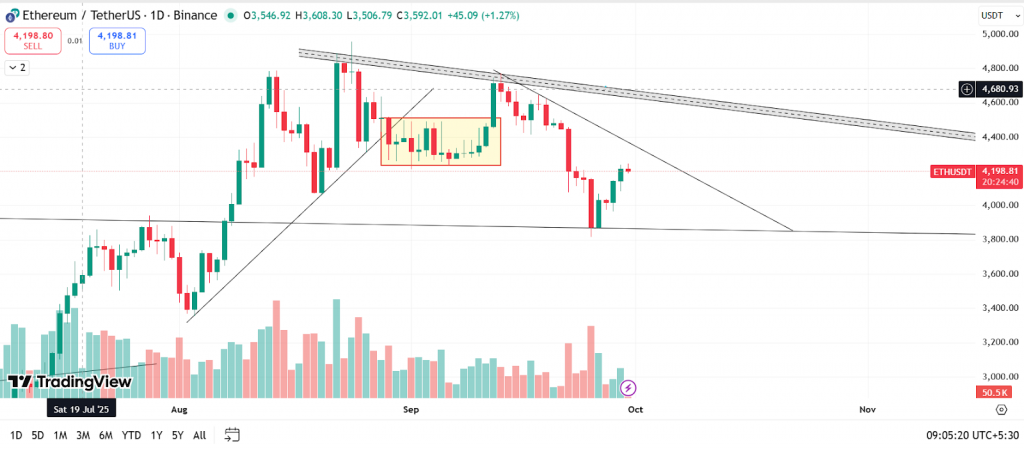
Current Price Action: ETH/USDT is recovering after a sharp drop, trading around 4,199 USDT. Short-term momentum appears bullish, but the price is still below all major descending trendlines, suggesting resistance and selling pressure remain significant.
As you can see in the chart, ETH is respecting the support and from that point itself it showed a short up move. If it breaks the single resistance trendline then we can see a rally till the major resistance trendline that is drawn in a parallel channel.
In case it breaks the support with good volume then we can see a bearish move.
Immediate Resistance: Watch the 4,350–4,400 USDT area for further selling and possible rejection as it aligns with descending trendline resistance.
Key Support: The 3,800USDT remains essential. A breakdown below this level could lead to further decline.
Pattern Implication: Until ETH can close and hold above the trendline resistance with high volume, caution is warranted for aggressive long positions. Monitoring for a breakout or another rejection will provide clarity for the next directional move.
At the time of writing, ETH was trading at $4,198.
Summary: The chart as of September 30, 2025, highlights Ethereum with strong resistance above and critical support below. Short-term recovery is underway, but the bears remain in control unless buyers can force a breakout above the descending trendline. Traders should remain vigilant for a decisive move in either direction, using risk management strategies appropriate to their position size and timeframe.
Key Levels:
| Support 2 | Support 1 | Asset | Resistance 1 | Resistance 2 |
| $3,800 | $3,975 | ETH | $4,350 | $4,750 |
Unravel everything that you need for your crypto journey via ZebPay blogs. Get started today and join 6 million+ registered users on ZebPay!