
Here is a technical analysis of ETH/USDT on a daily timeframe:
Ethereum is currently trading near the 3,000 USDT level, roughly midway between November’s high around 3,900 and the low near 2,615. In the short term, price action looks slightly positive, but overall, ETH is still moving within a broader downward-sloping range. At present, the price is getting squeezed between a falling resistance line from previous highs and a rising support line from the November low, so whichever side breaks first is likely to set the direction for the start of Q1 2026.
Looking at the structure, ETH has been making lower highs since September, creating a clear resistance zone around 3,400–3,600. This remains a key selling area, and a strong daily close above it would be the first meaningful sign that the trend is turning bullish.
On the downside, ETH has formed higher lows since late November, starting from around 2,615. Price has been respecting this rising support and is currently holding the 2,900–3,000 area, which shows that buyers are still stepping in at these levels. As long as this support holds, the market looks more like a healthy consolidation rather than a full downtrend.
Volume also supports this view. The heavy selling in November came with strong volume, but the recent bounce has occurred on much lower volume. This suggests that sellers are losing momentum, while buyers remain cautious. When volume contracts like this, it often signals that a larger move is approaching, either to the upside or the downside.
From a news perspective, Ethereum continues to lag because ETH ETF inflows are much weaker than Bitcoin’s. Even though Ethereum’s network fundamentals remain strong, this lack of institutional demand is one of the main reasons ETH has been underperforming relative to BTC.
At the time of writing, ETH was trading at $2,998.
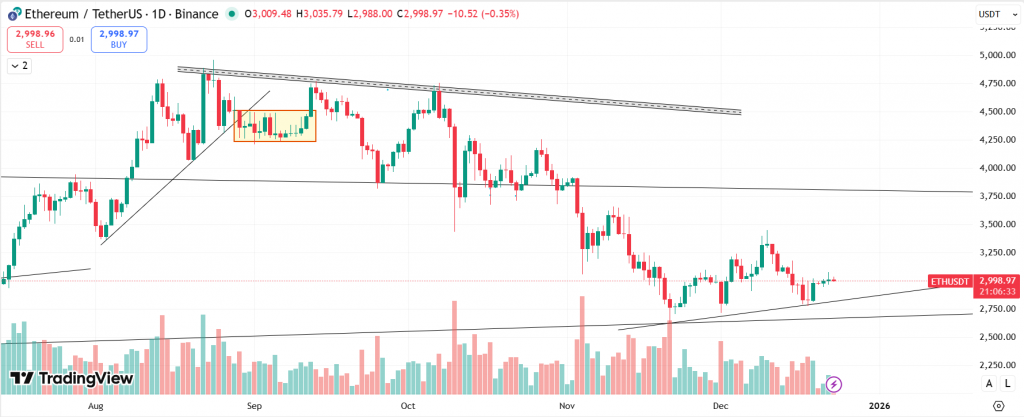
Summary: ETH is in a bearish-to-neutral corrective phase around $3,000, with price holding short-term support but still below key resistance at $3,500–$3,600. The trend turns bullish only on a strong reclaim above $3,600; otherwise, expect range-bound movement or downside continuation toward $2,700–$2,500.
Key Levels:
| Support 2 | Support 1 | Asset | Resistance 1 | Resistance 2 |
| $2,600 | $2,800 | ETH | $3,600 | $3,900 |
In the grand scheme of things, ZebPay blogs is here to provide you with crypto wisdom. Click on the button below and discover endless features on ZebPay!