

The last few years have seen the crypto market grow to billions of dollars in trades every day, 24 hours a day. But this amount of trading also generates massive amounts of data. This can make it difficult for individuals to know what to look for. This is where indicators come in. Indicators can help you interpret data and choose the best investment.
So what are the best indicators to look at and how do they work?
Introduction
Importance of Using Trading Indicators in Crypto
Indicators can help you identify trends in the price of a crypto. For example, moving averages can help you see whether the price trends up or down over time. Indicators can also identify support and resistance levels in the price of a crypto. Finally, they allow you to manage risk by providing information about volatility and potential price movements.
Criteria for Selecting the Best Indicators for Crypto Trading
Selecting the best indicators for your crypto trades depends on several factors, like your trading strategy, risk tolerance, and experience. Here are some steps you can take to help you choose the right indicators:
- Determine your trading strategy: Before selecting indicators, you should determine your trading strategy. Are you a trend follower, or a momentum trader, or do you go against market trends?
- Consider your risk tolerance: Some indicators are more volatile than others, so you should consider your risk tolerance when selecting indicators.
- Use indicators in combination: Finally, keep in mind that no single indicator is foolproof. It’s often best to use multiple indicators relevant indicators for analysis.
Read more: Crypto Investing vs Crypto Trading
Moving Averages (MA)
What is MA and How does it Work?
Moving averages are one of the most commonly used technical indicators in trading. They are a trend-following indicator that smooths out fluctuations in price over some time. A moving average is calculated by adding up a token’s closing prices and dividing by the number of periods.
There are different types of moving averages, including simple moving averages (SMA) and exponential moving averages (EMA). While SMA is calculated as mentioned above, EMA gives more weight to recent price movements.
How to Use MA to Identify Trends in Crypto Markets?
Moving averages are used to identify trends in the price of a crypto. When the price is above the moving average, it is considered to be in an uptrend. Similarly, when the price is below the moving average, it is in a downtrend. Traders often use moving averages in combination with other indicators to confirm market signals.
Relative Strength Index (RSI)
How does RSI Measure the Momentum of Price Movements
The relative Strength Index is an indicator used to measure the strength and momentum of price movements. RSI is a momentum oscillator that ranges between 0 and 100. 70 or above indicating an overbought condition, while 30 or below indicates an oversold condition.
RSI is calculated by comparing the magnitude of an asset’s recent gains to the magnitude of its recent losses over some time, typically 14 days.
How to Use RSI to Identify Overbought or Oversold Conditions in the Crypto Market?
Traders use RSI to identify potential trading opportunities based on overbought and oversold conditions. For example, when the RSI value is above 70, a trader may consider selling an asset, expecting a price correction. When the RSI value is below 30, a trader may instead take a long position, hoping for a price rebound.
Bollinger Bands (BB)
Overview of BB and How it Provides a Visual Representation of Volatility and Price Movements
Bollinger Bands is a popular technical analysis tool to measure the volatility of a token. They consist of three lines plotted on a chart: a simple moving average (SMA) in the middle, an upper band two standard deviations above the SMA, and a lower band two standard deviations below the SMA.
How to Use BB to Identify Trading Opportunities and Manage Risk in Crypto Markets?
Traders use Bollinger Bands to identify potential trading opportunities based on price movements. When the price of a crypto moves above the upper band, it is considered to be overbought. On the other hand, when the price of a crypto moves below the lower band, it is considered to be oversold.
Ichimoku Cloud
How Does Ichimoku Cloud Combine Multiple Indicators to Provide a Comprehensive View of the Market
Ichimoku Cloud is a technical analysis tool that combines multiple indicators into one. You can use it to identify trend direction, support and resistance levels, and potential trading opportunities. It was developed by Japanese journalist Goichi Hosoda in the 1930s and is widely used by traders around the world.
The Ichimoku Cloud consists of five lines and a shaded area, which creates a cloud-like appearance on the price chart. These are:
- Conversion Line (Tenkan-sen)
- Base Line (Kijun-sen)
- Leading Span A (Senkou Span A)
- Leading Span B (Senkou Span B)
- Lagging Span (Chikou Span)
How to Use Ichimoku Cloud to Identify Trends and Potential Entry and Exit Points in Crypto Markets?
Ichimoku Cloud is a versatile technical analysis tool that provides a comprehensive view of the crypto’s price action. When the price of an asset is above the cloud, it is in an uptrend. When the price is below the cloud, it is considered to be in a downtrend.
Traders also look for crossovers between the conversion and base lines, which can indicate buy or sell signals. In addition, the lagging span is used to confirm the trend direction.
Fibonacci Retracement
How does Fibonacci Retracement use Key Levels to Identify Potential Support and Resistance Levels
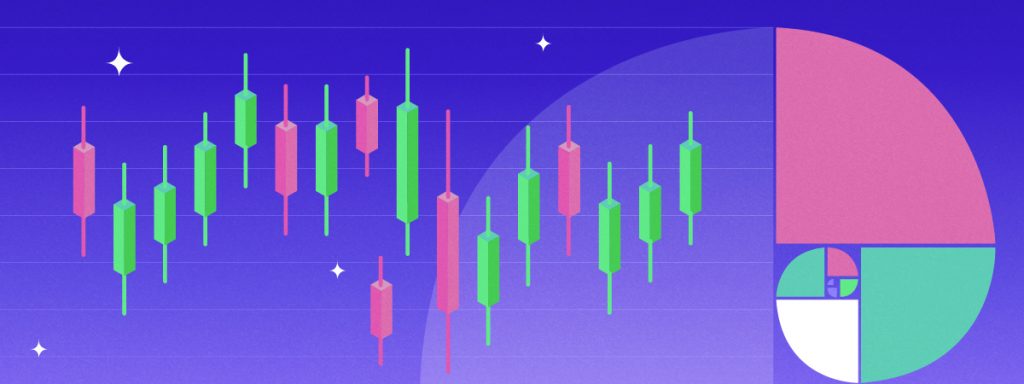
Fibonacci retracement is used by traders to identify potential support and resistance levels in a price chart. It is based on the idea that prices tend to retrace a portion of a move, after which they continue in the original direction.
To apply Fibonacci retracement, a trader identifies the most recent high and low points in a price chart. Then, they draw horizontal lines at the Fibonacci levels of 23.6%, 38.2%, 50%, 61.8%, and 100%. These levels represent the potential areas of support and resistance in the crypto’s price movement.
How to Use Fibonacci Retracement to Identify Potential Entry and Exit Points in Crypto Markets?
When the price of a crypto retraces from a recent high or low, a trader can use the Fibonacci retracement levels to identify support or resistance. For example, if the price retraces to the 38.2% level, this can be a potential area of support for buyers to enter. If the price instead retraces to the 61.8% level, it may be a potential area of resistance for sellers to enter the market.
Read more: Futures Trading Vs Margin Trading
Stochastic Oscillator
Introduction to Stochastic Oscillator
The Stochastic Oscillator is a tool used by traders to identify potential reversal points in a price chart. It is based on the idea that an asset’s price tends to close near the high or low of the recent trading range.
The Stochastic Oscillator measures the level of the closing price relative to its trading range over a given period. It consists of two lines, %K and %D, which are plotted on a scale from 0 to 100.
How to Use Stochastic Oscillator to Identify Potential Entry and Exit Points in Crypto Markets?
When the %K line crosses above the %D line, it is a bullish signal, indicating that the crypto’s price is likely to rise. Conversely, when the %K line crosses below the %D line, it is considered a bearish signal, indicating that the crypto’s price is likely to fall.
Traders also look for overbought and oversold levels on the Stochastic Oscillator. When the %K line is above 80, the crypto is considered overbought. Similarly, it is considered oversold when %K is below 20.
MACD (Moving Average Convergence Divergence)
Overview of MACD and How it Uses Moving Averages to Identify Potential Trend Reversals
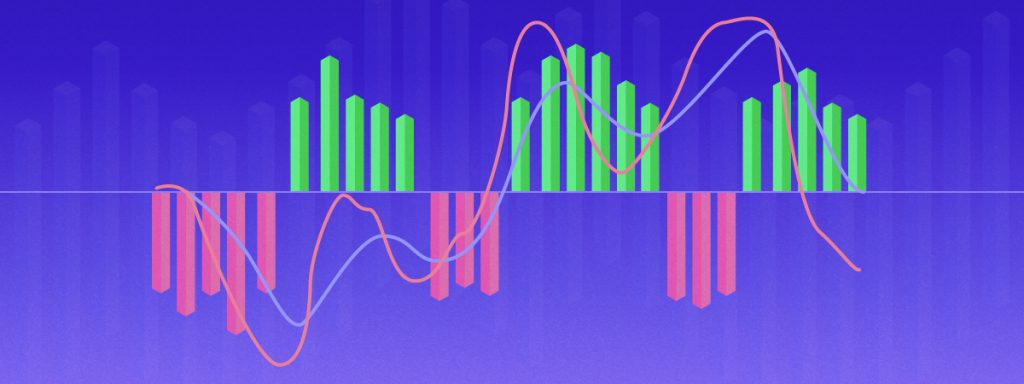
MACD is a popular technical analysis tool used for trend reversals and momentum shifts in a price chart. It is calculated by subtracting the 26-period Exponential Moving Average (EMA) from the 12-period EMA. A 9-period EMA of the MACD, known as the “signal line,” is then plotted on top of the MACD. The MACD histogram is the difference between the MACD and the signal line.
How to use MACD to Identify Trading Opportunities and Manage Risk in Crypto Markets?
The MACD histogram oscillates above and below the zero line. When the MACD histogram crosses above the zero line, it is considered a bullish signal. Conversely, when it crosses below the zero line, it is considered a bearish signal. The divergence between MACD and the crypto’s price can also be an indicator of momentum.
On-Balance Volume (OBV)
Introduction to OBV and How it Measures Buying and Selling Pressure
On-Balance Volume (OBV) is a technical analysis tool used to measure buying and selling pressure in a price chart. It is based on the idea that the volume of a traded asset can provide insight into the strength of its price trend. OBV is calculated by adding the volume on up days and subtracting the volume on down days.
How to Use OBV to Identify Potential Trend Reversals and Trading Opportunities in Crypto Markets?
When the OBV line is moving up, it is considered a bullish signal, indicating that buying pressure is increasing. Conversely, when the OBV line is moving down, it is considered a bearish signal, indicating that selling pressure is increasing. The divergence between OBV and the token’s price can also be used to predict reversals.
Volume
Intro to Trading Volume
Volume refers to the total number of units of a crypto that are traded over time, usually in a day or week. It is an important indicator that traders use to assess the strength of price movements in the crypto market.
How to Use Volume to Confirm Trading Signals and Identify Potential Trading Opportunities in Crypto Markets?
When the volume is high, it suggests that a large number of buyers and sellers are actively participating in the market. Conversely, when the volume is low, it suggests that there is less interest in the token. Interest and participation can thus influence the price of a crypto token.
Volume is often used in conjunction with other technical indicators to make trading decisions. For example, high volume during an uptrend could indicate that the trend is likely to continue. However, low volume during an uptrend could suggest that a reversal may occur.
Read more: Guide To Crypto Technical Analysis
Conclusion
Recap of Key Points
Indicators are simplified representations of data, which make it easier for traders and investors to act on price information. There are several popular indicators used in trading, including Relative Strength Index, Bollinger Bands and Moving Average Convergence Divergence. Each indicator serves a different purpose. Some are used to predict trend reversals while others measure momentum and market pressure.
Read more: How To Pick A Crypto For Day Trading
Final Thoughts on the Importance of Using Trading Indicators for Successful crypto Trading
With the amount of data available today, it is very easy to get overwhelmed. Successful traders are those who can prioritize information and focus on the assets that bring them the most returns. The most effective tools to choose such assets are the trading indicators mentioned above. Focus on the right indicators and do not overload your dashboard to make the best of your portfolio.
You can keep yourself up to date with the latest crypto news on ZebPay blogs. Want to make our day? Share this blog post with your friends and family if you like it. It will help us reach out to more like minded enthusiasts like you.