
Bitcoin approached the weekly close under pressure, struggling to reclaim its 200-day exponential moving average (EMA), a key level it has repeatedly failed to hold as support, raising the risk of it turning into resistance. Macro tensions are also in focus. With no signs of de-escalation in the U.S.–Iran conflict, WTI crude futures jumped nearly 19% to around $108 per barrel, their highest level in about four years. The sharp move in oil has pushed traders to closely watch inflation expectations and broader risk sentiment. Despite the uncertainty, institutional demand for Bitcoin is showing signs of recovery. Spot Bitcoin ETFs recorded about $568 million in net inflows this week, following $787 million the week prior, suggesting renewed investor appetite after a period of outflows.
Also Read: What Are Crypto Options? A Complete Guide!
At the time of writing, BTC was trading at $66,483.
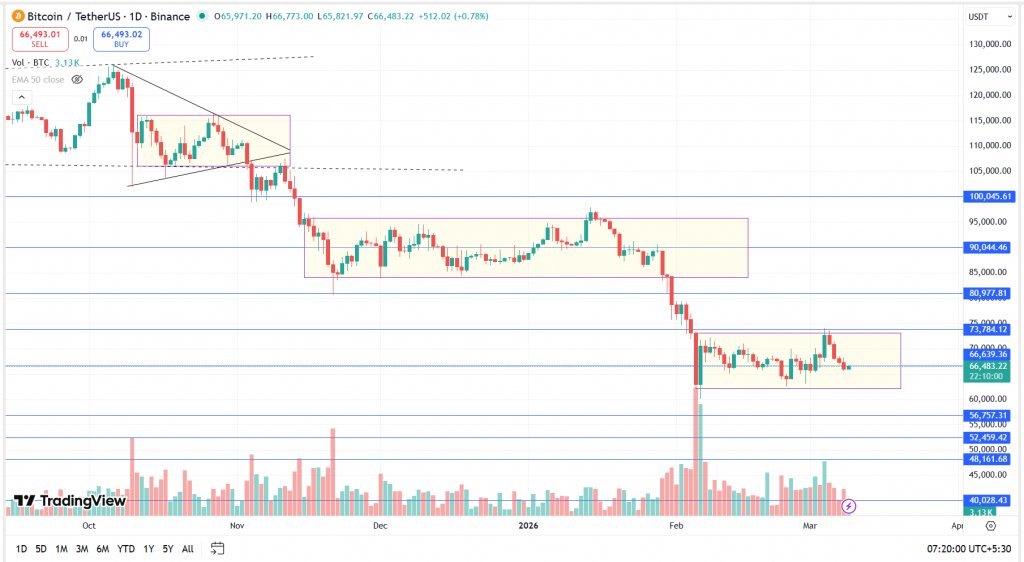
After making a recent low of $60,000, BTC formed a strong green candle and bounced to $71,750. However, the bulls failed to deliver a follow-through rally. Following this move, the asset has continued to trade sideways in a range between $65,000 and $74,000 with low volumes, forming a Rectangular Pattern, where the upper horizontal trendline acts as resistance and the lower horizontal trendline acts as support. Breakouts on either side of the range will likely determine the asset’s next trend.
Also Read: How To Read Candlestick Patterns?
Key Levels
| Support 2 | Support 1 | Asset | Resistance 1 | Resistance 2. |
| $60,000 | $65,000 | BTC | $75,000 | $80,000 |
Unravel everything that you need for your crypto journey via ZebPay blogs. Get started today and join 6 million+ registered users on ZebPay!