


Here is a technical analysis of ETH/USDT on the daily timeframe:
Market Overview
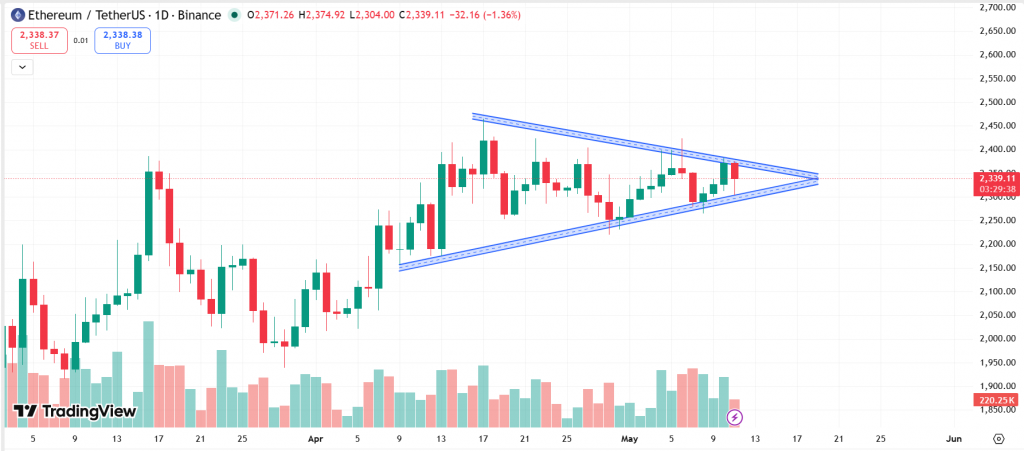
Ethereum is currently trading around $2,340 and is moving within a clear symmetrical triangle pattern on the daily timeframe. After the strong recovery from the February lows near $1,800, ETH managed to climb back above $2,300. However, over the last few weeks, the market has started slowing down and compressing into a tighter range. Right now, the chart is showing a market preparing for a bigger move, but the direction is still not confirmed.
Recent Price Action
Over the past few days, ETH has been making both lower highs and higher lows, forming the triangle pattern visible on the chart. This usually indicates that buyers and sellers are currently in balance. Price has attempted multiple breakouts near the upper trendline around $2,380–$2,400, but sellers continue to defend that zone. At the same time, buyers are stepping in near the lower support trendline around $2,250–$2,280, preventing deeper declines. This tightening range suggests that volatility is decreasing and that a breakout move may happen soon.
Current Structure and Trend
The short-term structure is neutral to slightly bullish because ETH is still holding above important support zones and has not broken down from the pattern. However, momentum is weakening compared to the earlier recovery rally. Candles are becoming smaller, and the market is no longer showing aggressive buying pressure. This tells us that:
- Buyers still have some control
- The market is waiting for a trigger
Also Read: Ethereum Price Prediction
Volume and Momentum
Volume has remained relatively average during this consolidation phase. There has been no major spike in buying or selling activity yet. This is important because triangle patterns usually require a strong increase in volume during a breakout to confirm the next move. Without volume confirmation, fake breakouts become more likely.
At the time of writing, ETH was trading at $2,340.
Summary
Ethereum is currently consolidating inside a symmetrical triangle near $2,340 after a strong recovery rally. The market is showing stability, but momentum has slowed, and buyers are struggling to break above the $2,400 resistance zone. As long as ETH holds above $2,250, the structure remains slightly bullish in the short term. However, a confirmed breakout with strong volume is still needed before calling this a full trend reversal. Right now, ETH appears to be a market building pressure ahead of its next major move.
Key Levels
| Support 2 | Support 1 | Asset | Resistance 1 | Resistance 2 |
| $2,000 | $2,200 | ETH | $2,400 | $2,700 |
In the grand scheme of things, ZebPay blogs are here to provide you with crypto wisdom. Get started today and join 6 million+ registered users to explore endless features on ZebPay!