


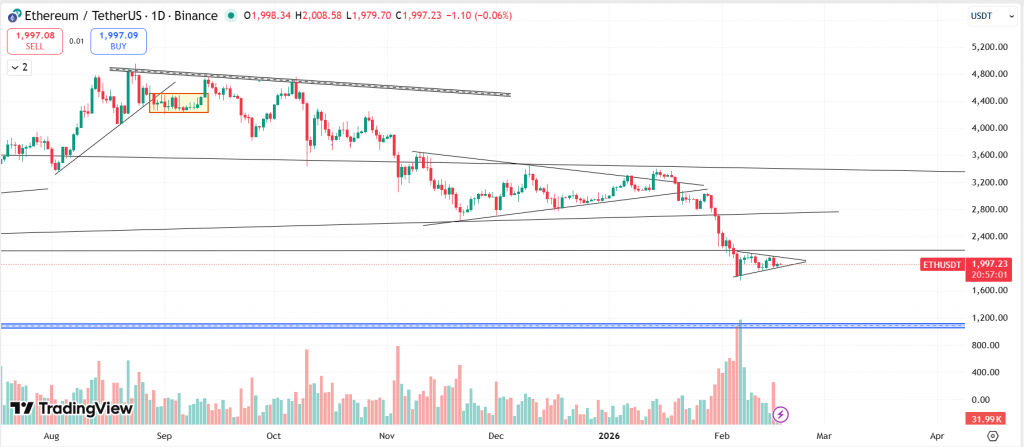
On the daily timeframe, Ethereum (ETH) continues to trade within a clearly defined bearish market structure. The decisive breakdown below the $2,200 support zone confirmed underlying weakness and reinforced the broader downtrend.
Following this breakdown, ETH has failed to show any meaningful bullish reversal signals. There have been no higher highs, nor has price managed to sustain a recovery above key resistance levels, keeping the bearish bias intact.
Over the past few sessions, ETH has entered a sideways consolidation phase after the sharp decline. This consolidation is forming just below the previous support area, which has now flipped into resistance. Instead of immediate follow-through, price action has compressed into a symmetrical triangle pattern on the daily chart.
Also Read: Top 10 dApp Tokens of February 2026
A symmetrical triangle reflects volatility contraction and market indecision, with both buyers and sellers actively participating. Price is forming lower highs and higher lows within the structure, signalling pressure building for a larger directional move. Such patterns typically precede a strong expansion in volatility, especially after an impulsive move.
Given that this triangle has formed after a strong bearish impulse, it is more likely to act as a continuation pattern rather than a reversal. As a result, downside risk remains slightly favoured unless buyers step in with strong volume and reclaim key resistance levels.
For a bullish scenario to gain traction, ETH must break above the triangle resistance and reclaim the $2,200 level with strong daily closes supported by rising volume. Without this confirmation, any upside movement is likely to remain a short-term relief rally within a broader downtrend.
On the downside, a confirmed breakdown below the triangle support, accompanied by strong selling pressure, could trigger the next leg lower. In that case, lower support zones would come into focus, with volatility expected to expand once again.
Also Read: Top 10 Layer-1 Blockchain Cryptos in 2026
Currently, ETH remains in a compression phase, with no significant price expansion observed over the past week. While the structure is neutral in the very short term, the overall trend remains bearish. The next decisive move is likely to occur only after a confirmed breakout or breakdown from the symmetrical triangle, supported by increased volume.
ETH is also trading below all major EMAs, further reinforcing the prevailing bearish trend.
At the time of writing, ETH was trading at $1,997.
Summary: ETH remains in a bearish daily structure after breaking the major $2,200 support, with no confirmed trend reversal yet. Price is consolidating in a symmetrical triangle, showing volatility compression and market indecision. A breakout with strong volume will decide the next major move, but trend bias still slightly favors downside continuation unless $2,200 is reclaimed.
Key Levels
| Support 2 | Support 1 | Asset | Resistance 1 | Resistance 2 |
| $1,500 | $1,800 | ETH | $2,200 | $2,800 |
In the grand scheme of things, ZebPay blogs are here to provide you with crypto wisdom. Get started today and join 6 million+ registered users to explore endless features on ZebPay!