

Here is a technical analysis of ETH/USDT on a daily timeframe:
Chart Technical Analysis
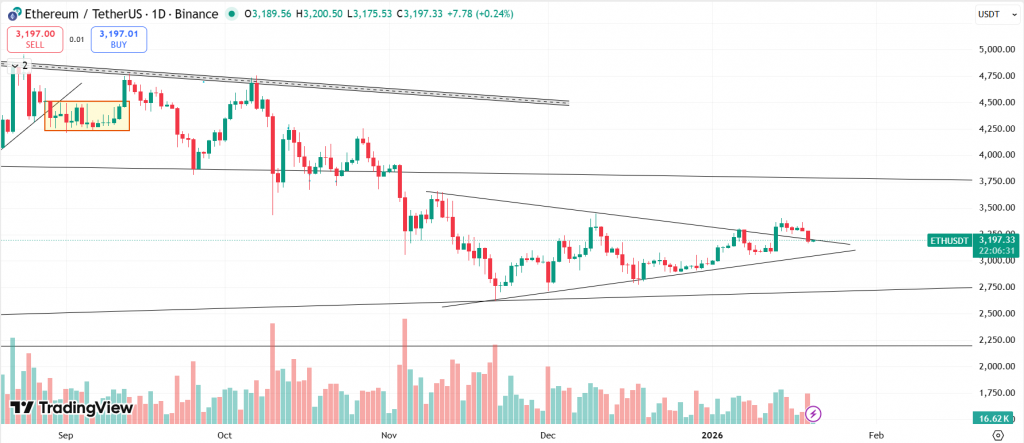
Current Price: $3,195 (ETH/USDT)
ETH broke the symmetrical triangle pattern, but due to low volumes and reduced buying interest, it failed to sustain the breakout and is now moving sideways.
Overall Trend
Ethereum is still in a broader downtrend after falling from the 4,700–4,800 region. However, the strong selling phase has slowed, and the price is now moving sideways. This indicates that the market is pausing and building pressure for the next move.
Pattern Formation
The most important structure on the chart is a symmetrical triangle.
Price is making higher lows, showing that buyers are slowly stepping in.
At the same time, lower highs indicate that sellers are still active.
This pattern reflects indecision, not direction. The next strong move will define the trend.
Also Read: What is WINkLink (WIN)?
Volume Analysis: Volume has been gradually decreasing, which is normal during triangle formation. A real breakout should come with clearly rising volume. Any move without volume confirmation should be treated cautiously.
Possible Scenarios
Bullish Scenario: A daily close above 3,300 USDT with strong volume could push ETH toward 3,750–4,000 USDT.
Bearish Scenario: A daily close below 2,850 USDT may lead to a decline toward 2,400–2,200 USDT.
Conclusion
ETH/USDT is at a critical decision zone. This is not the stage to predict direction. The safest approach is to wait for a confirmed breakout with volume and trade in the direction of that move.
At the time of writing, ETH was trading at $3,195.
Summary: Ethereum is trading near 3,200 USDT and is currently in a consolidation phase after a prolonged downtrend. Price is forming a symmetrical triangle, showing indecision between buyers and sellers. Volume is declining, which suggests a strong move is likely soon. A confirmed daily close above 3,300 USDT could lead to further upside toward 3,750–4,000, while a break below 2,850 USDT may trigger a drop toward 2,400–2,200. The best approach is to wait for a clear breakout with volume before taking positions.
Key Levels:
| Support 2 | Support 1 | Asset | Resistance 1 | Resistance 2 |
| $2,800 | $3,000 | ETH | $3,300 | $3,400 |
In the grand scheme of things, ZebPay blogs are here to provide you with crypto wisdom. Get started today and join 6 million+ registered users to explore endless features on ZebPay!