


Here is a technical analysis of ETH/USDT on a daily timeframe:
Market Structure and Trend Context
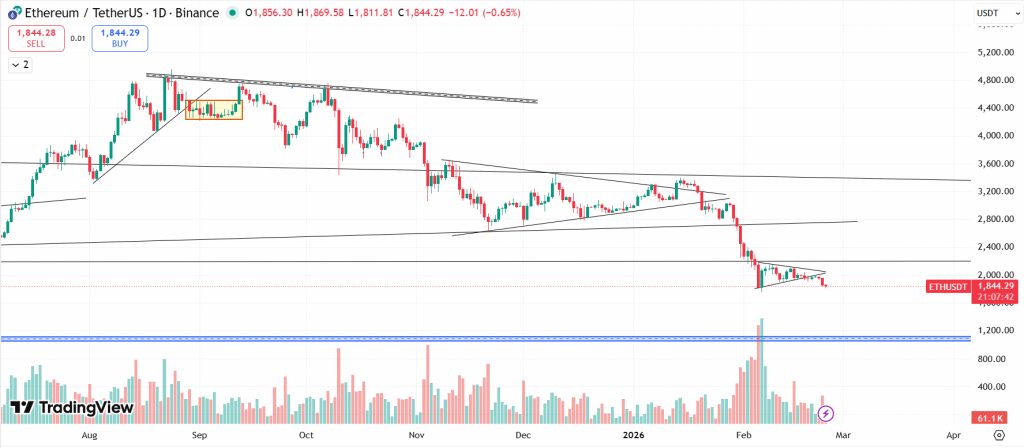
Ethereum on the daily timeframe remains in a clear bearish market structure. Since topping near the 4,800 region, price has consistently formed lower highs and lower lows, confirming sustained downside control. The long-term descending trendline continues to cap upside attempts, and prior breakdown zones have not been meaningfully reclaimed. The recent impulsive sell-off from the 3,000–3,200 area further reinforced bearish dominance, shifting the broader structure decisively in favor of sellers. At this stage, the macro trend cannot be considered neutral or bullish unless key structural resistance levels are recovered and held.
Also Read: Are Big Investment Banks and Hedge Funds Trading in Bitcoin?
Recent Price Action and Breakdown Dynamics
The breakdown below the 3,000 region marked a significant structural failure, triggering an acceleration phase toward the 2,000 psychological level. This move was accompanied by a sharp expansion in volume, suggesting liquidation-driven momentum rather than gradual distribution. After reaching the lower 2,000 area, price attempted a modest recovery but failed to establish a higher high on the daily timeframe. The rejection from the rising wedge formation and subsequent continuation lower confirm that recent rallies have been corrective rather than impulsive in nature.
NOTE: Currently, price has broken the symmetrical triangle and remains in the bearish zone.
Support and Resistance Structure
Immediate resistance is located around 2,000–2,100, which previously acted as support before the breakdown and now functions as a supply zone. Above that, the 2,300–2,400 area represents a key structural breakdown level where significant selling pressure previously emerged. The 2,800–3,000 zone remains the major macro resistance cluster and would need to be reclaimed to consider a larger trend reversal.
On the downside, immediate support sits near 1,750–1,800. A clean break below this region could expose the 1,500–1,600 demand zone. Beneath that lies the major historical support area around 1,100–1,200, which stands out as a high-probability reaction zone should broader market weakness persist.
No Sign of Bullishness
For bullish invalidation, price would need to break above 2,100 convincingly, reclaim 2,400, and establish a higher low on the daily timeframe. Without these developments, upside moves are likely to be corrective rallies within a broader bearish cycle.
At the time of writing, ETH was trading at $1,844.
Also Read: Bitcoin: Peer-to-Peer Electronic System Explained
Summary
Ethereum’s daily chart remains structurally bearish, with price consolidating after a significant breakdown. Volume behavior, market structure, and pattern formation collectively suggest that downside risk persists unless key resistance levels are reclaimed. While short-term bounces are possible, the broader technical picture continues to favor sellers until proven otherwise.
Key Levels
| Support 2 | Support 1 | Asset | Resistance 1 | Resistance 2 |
| $1,500 | $1,800 | ETH | $2,200 | $2,800 |
In the grand scheme of things, ZebPay blogs are here to provide you with crypto wisdom. Get started today and join 6 million+ registered users to explore endless features on ZebPay!