


Here is a technical analysis of ETH/USDT on a daily timeframe:
Chart Technical Analysis
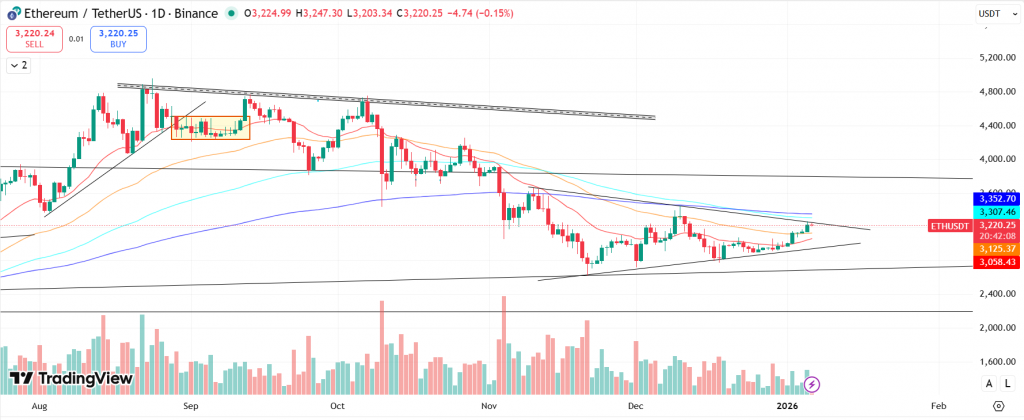
Current Price: $3,220–$3,225 (ETH/USDT)
Trend Structure:
ETH is trading within a compression phase, where price is forming higher lows along an ascending trendline drawn from the 21st November low, while facing consistent rejection from a descending resistance trendline originating from the September–October highs. This structure resembles a tightening wedge, indicating a potential directional expansion ahead.
Despite the short-term recovery, the broader trend remains corrective, as price has not yet reclaimed higher timeframe resistance zones.
Moving Averages & Volume:
Price is currently testing the 20 and 50 EMA but remains below the 100 EMA and 200 EMA, reflecting ongoing bearish pressure at higher levels.
The 200 EMA near $3,350–$3,400 continues to act as a major overhead supply zone.
The recent upside move lacks strong conviction and requires confirmation through expansion.
Key Support & Resistance Levels:
Support Levels
S1: $3,000 – Confluence of a psychological level and the rising trendline from 21st Nov
S2: $2,800 – Major demand zone and November swing low
Resistance Levels
R1: $3,250–$3,300 – Descending trendline resistance + EMA cluster
R2: $3,350–$3,400 – 200 EMA and higher timeframe supply zone
A decisive close above R1 could expose R2, while a loss of S1 would invalidate the rising structure.
Probable Breakout / Breakdown Scenarios
Bullish Case: A sustained daily close above $3,300, accompanied by volume expansion, would confirm a breakout from the compression structure and open upside potential toward $3,350–$3,400.
Bearish Case: Failure to hold the ascending trendline from 21st November, followed by a breakdown below $3,000, could trigger a move back toward the $2,800 demand zone.
At the time of writing, ETH was trading at $3,220.
Summary: ETH is trading within a tightening structure, supported by a rising trendline from 21st November while facing rejection from long-term descending resistance. The short-term bias is improving, but price remains below major moving averages, keeping the broader trend corrective. A sustained breakout above the $3,300 zone could trigger further upside, while a breakdown below $3,000 would weaken the current structure and expose lower supports.
Key Levels:
| Support 2 | Support 1 | Asset | Resistance 1 | Resistance 2 |
| $2,800 | $3000 | ETH | $3,300 | $3,400 |
In the grand scheme of things, ZebPay blogs are here to provide you with crypto wisdom. Get started today and join 6 million+ registered users to explore endless features on ZebPay