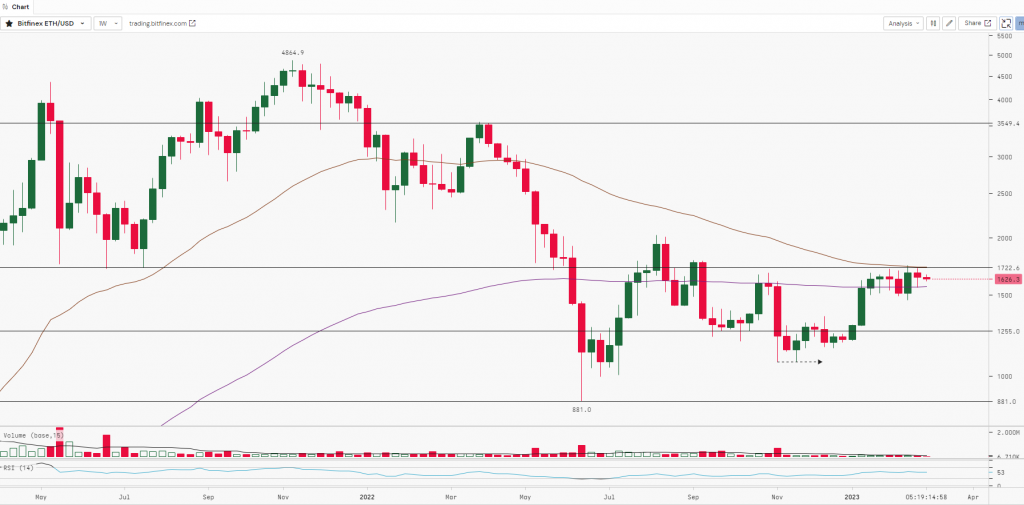
Ether bounced off the 50-day SMA ($1,587) on 25th February suggesting the bulls are actively defending this level. The 20-day EMA ($1,626) has settled and the RSI is just above the midpoint, indicating an equilibrium between supply and demand. Regulatory pressures, mainly from the US, partly explain investors’ justification for deteriorating market conditions. The asset price has fallen marginally by 0.34% while the global volume has risen by almost 25% to $7.22 bn. Ether’s dominance is at 18.62%.
At the time of writing, ETH was trading at $1,623.6

ETH after making a ‘Spinning Top’ candle at the low of $1,075 started moving up and the price surged almost by 62% within three months. Post this move, the asset started consolidating between $1,550 to $1,725. ETH has very strong resistance at $1,750 (Horizontal Trendline) and as we can see from the weekly chart above, it is struggling to break the key level. Hence, to further rally the asset needs to break, close and sustain above $1,750. Once it does that then we can expect the prices to rally up to $2k. ETH has strong support at $1,500.
| Support 2 | Support 1 | Asset | Resistance 1 | Resistance 2 |
| $1,250 | $1,500 | ETH | $1,750 | $2,000 |

