Bitcoin begins a new week at the centre of fresh drama which has put pressure on price action. Traders are faced with Downside volatility thanks to a full memepool and explanations pointing fingers at multiple parties. Amid the turmoil, BTC/USD is showing signs of stress and breaking out of $28,000 to threaten a breakout of its broader trading range. These events mark a nervous start to a week already filled with potential BTC price volatility catalysts. These catalysts come in the form of macroeconomic data releases, including the consumer price index (CPI), as well as first quarter earnings reports of various companies. BTC’s dominance is at 46.89%, while the global volume is up by more than 21% in the last 24 hours.
At the time of writing, BTC was trading at $28,178

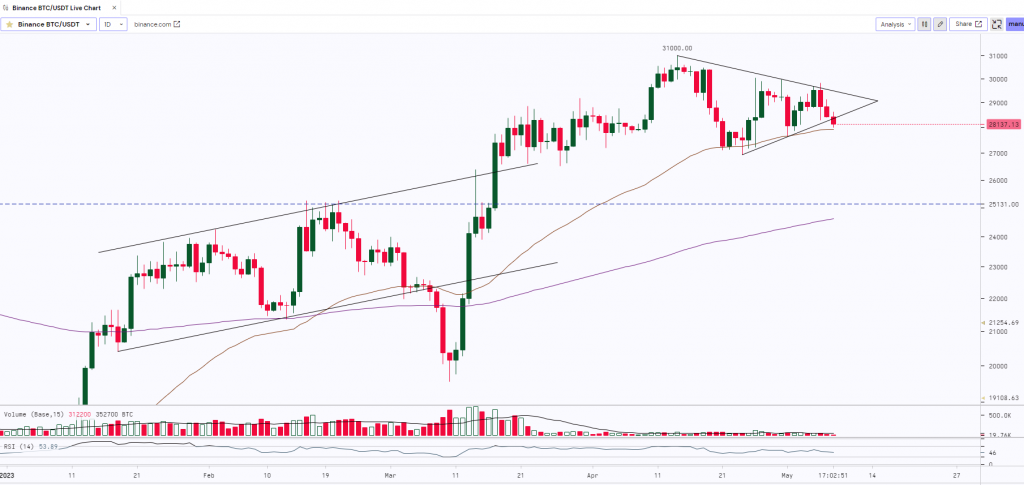
BITCOIN after witnessing a rally from $19,550 to $31,000 continues to trade in a range forming a ‘Symmetrical Triangle’ pattern with low volumes where the upper downsloping trendline is acting as a resistance and the lower upsloping trendline is acting as a support for the asset. BTC is also taking good support at its 50 Day Moving Average. If the prices give a daily close below the pattern and the 50 Day Moving Average, then we may expect some correction and the prices may drop to the next support level which is at $25,000. To witness a rally BTC needs to break and close above the ‘Symmetrical Triangle pattern. $32,500 will act as a strong resistance for the asset.
Key Levels:
| Support 2 | Support 1 | Asset | Resistance 1 | Resistance 2. |
| $25,500 | $28,000 | BTC | $32,000 | $37,500 |

