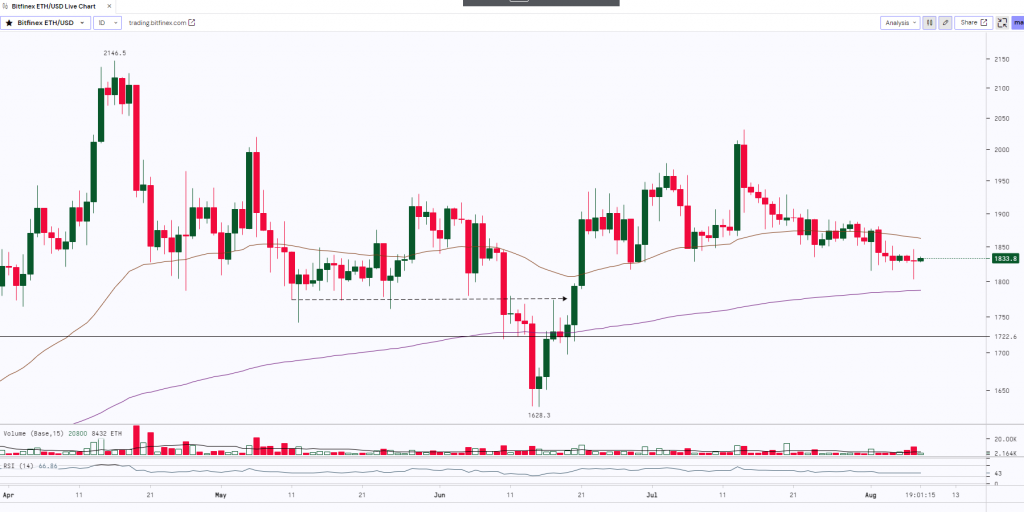
Despite the bulls’ efforts to maintain Ether’s position above the immediate support level of $1,816 in recent days, they are encountering challenges in initiating a robust recovery. This suggests a lack of demand at higher price levels. The 20-day exponential moving average is trending downward at $1,856, and the Relative Strength Index in negative territory indicates that the bears currently hold an advantage. Additionally, there has been a continuation of negative trends in funds, with outflows totalling $5.9 million in the most recent week, following the previous week’s outflows of $1.9 million. This divergence from other altcoins, such as Solana and BCH, which are currently experiencing a bullish trend, highlights the unique challenges currently faced by Ether.
At the time of writing, ETH was trading at $1,833.5.

ETH after making the recent high of $2,031.4 (last month) has been trading in a downtrend and the prices have corrected almost by 11% making a low of $1,802.6. The asset made a Long Legged Doji candle at the low indicating indecision in trend. ETH has a very strong support zone from $1,800 to $1,750. If it holds and sustains above the support then we can expect the bulls to resume the up move whereas a break below the support will lead to further downfall.
| Support 2 | Support 1 | Asset | Resistance 1 | Resistance 2 |
| $1,610 | $1,750 | ETH | $1,950 | $2,150 |

