SOL has a market cap of $39.92 billion, as of date, and the total crypto market cap stands at $2.14 trillion:
- Allfunds is expanding tokenized funds to Solana, connecting over 3,300 asset managers and roughly €1.8 trillion in assets under administration to the network.
- South Korea’s Kospi crashed 10%, triggered by demand for lower-priced AI chips.
- MoneyGram has joined Solana as a validator, deepening its move from a blockchain payments user to active infrastructure participant.
- Baillie Gifford launched a UK-regulated tokenized fund on Solana (SOLUSD context).
On the daily chart, Solana is currently trading around $68.87 and has lost nearly 9% over the last few trading days. After facing resistance at the $74 level, it is expected to remain under pressure for some time. Profit booking is being observed across crypto assets.
Technical Chart of SOL
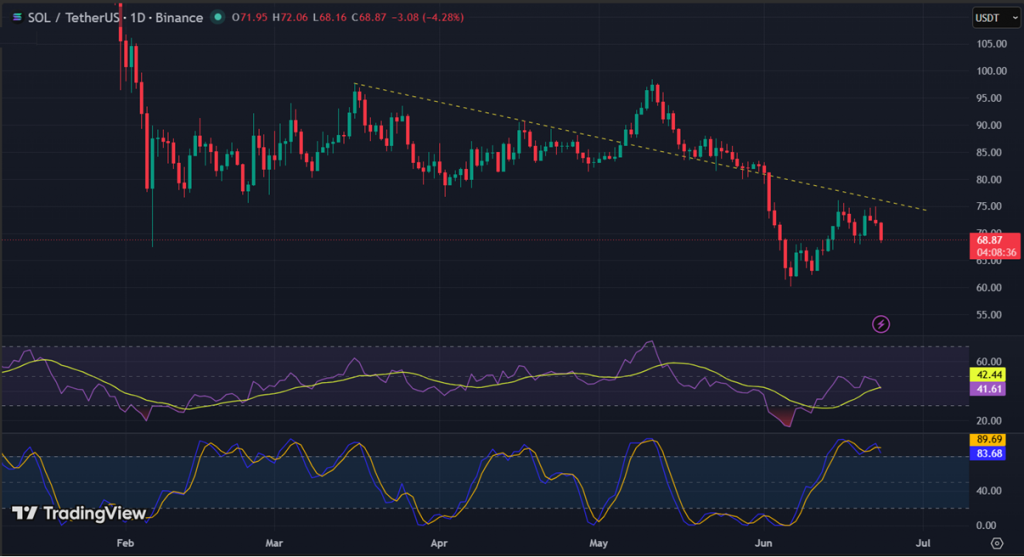
On the daily chart, SOL is trading below its Simple Moving Average (14 & 21 periods) levels of $72.90 and $75.16, which are expected to act as resistance in the coming sessions.
On the daily chart, the Relative Strength Index (RSI) is at 41.61 and the Stochastic Oscillator is at 83.68. While the Stochastic indicates an overbought zone, the RSI has shifted into negative territory, suggesting that selling pressure may be seen in the coming sessions.
Also Read: Bitcoin & Gold: Understanding the Two Asset Classes
Support and Resistance Levels
| Support 2 | Support 1 | Asset (Price) | Resistance 1 | Resistance 2 |
| $59.60 | $63.15 | SOL ($68.87) | $73.88 | $78.97 |
Above $78.97, there’s a possibility of hitting the $89 levels.
In the grand scheme of things, ZebPay blogs are here to provide you with crypto wisdom. Get started today and join 6 million+ registered users to explore endless features on ZebPay!