

Bitcoin has been trading in a relatively tight range around the $26,000 level, and market indicators are sending mixed signals, making it difficult to determine whether the bulls or bears currently have the upper hand. The downsloping moving averages suggest a bearish trend, but the positive divergence on the relative strength index (RSI) indicates a potential reduction in selling pressure.
At the time of writing, BTC was trading at $25,750.
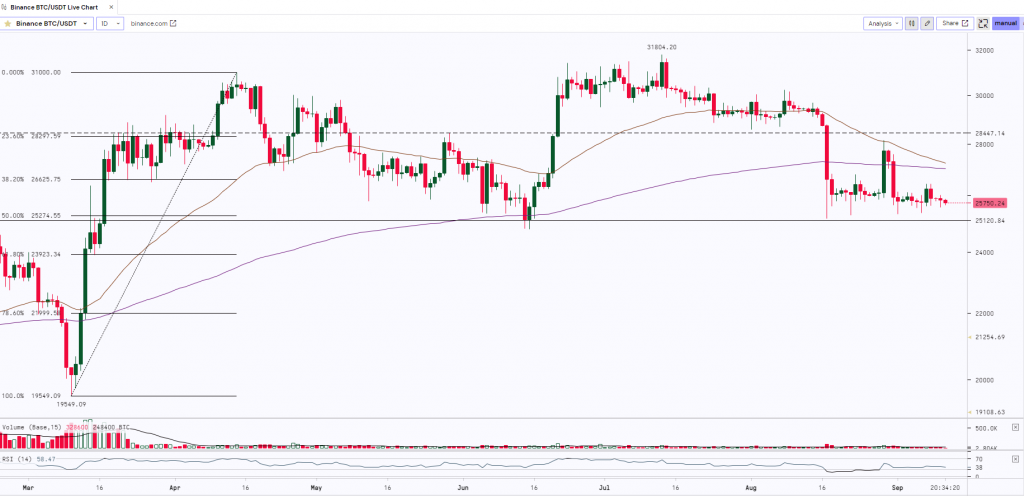
Bitcoin continues to trade sideways from $25,500 to $26,500 with low volumes. The bulls are defending the crucial support level of $25,000 (Horizontal Trendline & 50% Fibonacci retracement Level). If it holds and sustains above the support then we may expect the bulls to resume the up move whereas a break below the support will lead to further downfall. $32,500 will be the major hurdle for bulls and to witness a rally BTC needs to break, close and sustain above the resistance level of $32,500.
Key Levels:
| Support 2 | Support 1 | Asset | Resistance 1 | Resistance 2. |
| $22,000 | $25,000 | BTC | $28,500 | $32,500 |

