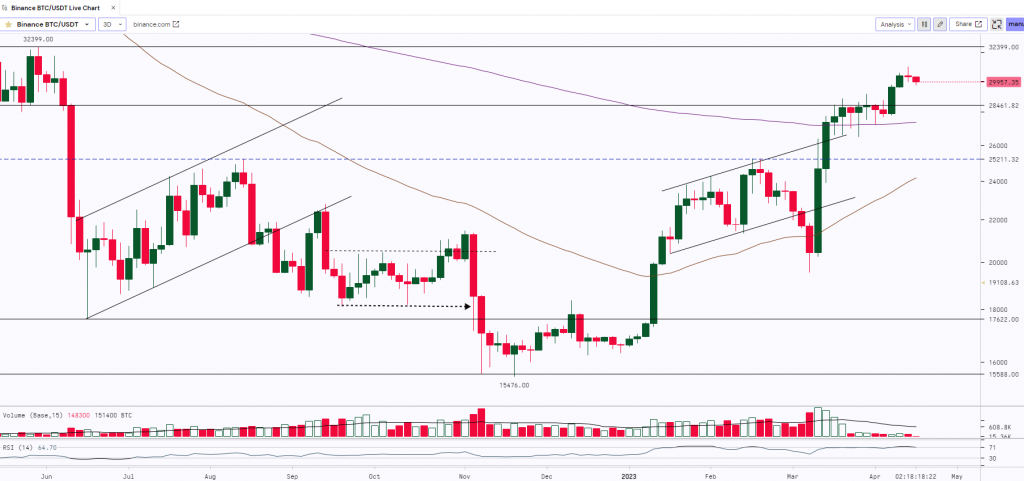
Bitcoin’s recent surge to a nine-month high is a positive indication that the medium-term downtrend in the crypto market is beginning to reverse. Even though the daily charts are showing a bullish trend, a consolidation can still be considered in the short-term. In the first quarter of 2023, BTC/USD broke the 200-day moving average, the 89-day moving average, indicating the start of an uptrend. March’s downside correction ended at the 200-day moving average, further supporting the upcoming uptrend. The global volume for the asset has risen by almost 32% while the dominance is at 45.72%.
At the time of writing, BTC was trading at $29,956.

BITCOIN after making the low of $15,476 started trading in an uptrend and witnessed a sharp rally. The asset faced stiff resistances at the key levels of $25,000 and $28,500. However, the bulls managed to break these levels and the prices made a high of $31,000. Technically, on a 3 Day time frame, Bitcoin has made a ‘Doji’ candle at the high which indicates indecision in trend. It also has a very strong resistance at $32,500. Hence, we can expect some consolidation or profit bookings from these levels and to further rally, BTC needs to break, close and sustain above $32,500 whereas $28,000 will act as a strong support for the asset.
Key Levels:
| Support 2 | Support 1 | Asset | Resistance 1 | Resistance 2. |
| $25,500 | $28,500 | BTC | $32,500 | $37,500 |


