
Bitcoin bulls aim to push the BTC price to $24,000 and in doing so LTC, AVAX, APT and FTM could extend monthly gains. So far, it’s up nearly 40% in January, which is its best start to a year since 2013. The strong move higher has turned multiple on-chain signals bullish, according to On-Chain data. The next fall will also confirm whether Bitcoin has formed a bottom or not. If the low is confirmed, several altcoins may start to outperform Bitcoin in the near term. The global volume is up by almost 46% in the last 24 hours, while BTC dominance is at 42.49%.
At the time of writing BTC was trading at $23,706.
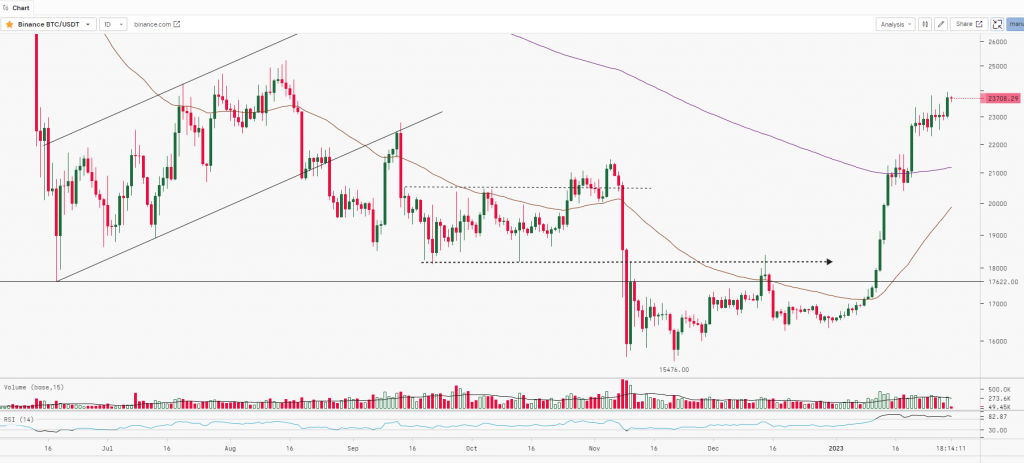
BTC after giving a breakout above the range started trading upwards by forming a ‘Higher High Higher Low’ pattern. The prices made a weekly high of $23,960 yesterday. The bulls will face a hurdle at around $25,200 (Previous Top on 15th August 2022) and $28,500 (Horizontal trendline). Once the prices break and sustain above these resistances then we can expect another rally up to $32k. If it resists at these levels then we can expect some profit booking. RSI above 80 on a daily time frame indicates that the asset is in the overbought zone.
Key Levels
| Support 2 | Support 1 | Asset | Resistance 1 | Resistance 2. |
| $17,500 | $21,500 | BTC | $25,250 | $28,500 |

