

Bitcoin sees a mixed opinion as the major $25,000 resistance combines with early signs of volatility. The asset enters the final week of February in a volatile mood as it fails to break a key resistance area. After a classic “false” during weekend’s low-volume trading, BTC/USD is back below $25,000 and the bulls are still lacking momentum. A Critical monthly close is expected, along with a potential external price trigger from Federal Reserve Annoucements. Meanwhile, Bitcoin network fundamentals are set to jump to another all-time high and miners are in full recovery mode. The global volume for Bitcoin is up by more than 50% while there is little change in price in the last 24 hours.
At the time of writing BTC was trading at $24,465.
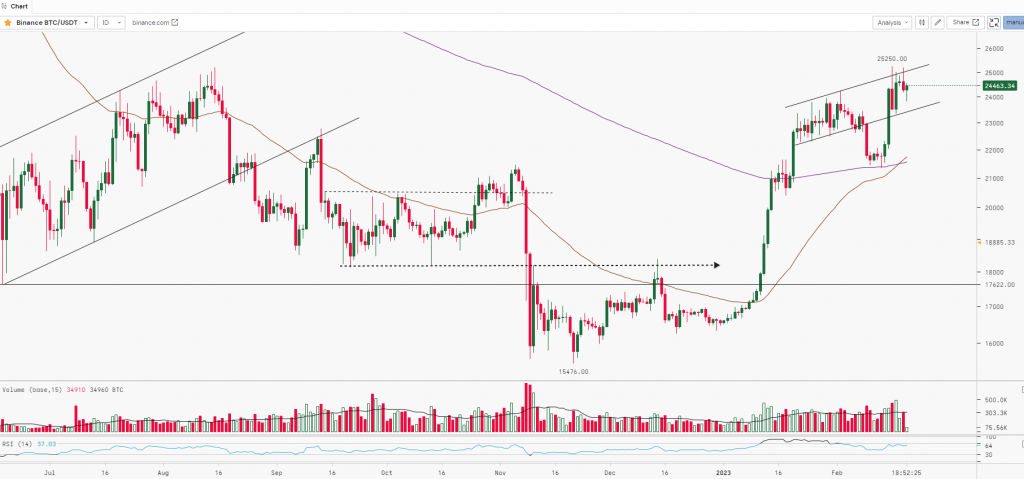
BTC after giving a breakout above the range ($16,000 to $17,500) witnessed a rally and the prices made the weekly high of $25,250. However, the asset faced strong resistance around $25,200 and witnessed some profit booking and dropped to $23,339. Post this move, the asset again went up to $25,192 but failed to break the resistance. BTC has not given a daily closing above $25k and the longer shadow at higher levels indicates selling around the key resistance level. Hence, to further rally, it needs to break, close and sustain above $25,250 whereas $21,500 to $20,500 will act as a strong support zone for the asset.
Key Levels:
| Support 2 | Support 1 | Asset | Resistance 1 | Resistance 2. |
| $17,500 | $21,500 | BTC | $25,250 | $28,500 |

