
Bitcoin has maintained its position around the $52,000 mark following a significant rally across the crypto market. This rally has propelled Ether, the second-largest crypto, back to its levels prior to the collapse of the TerraUSD stablecoin nearly two years ago. Bitcoin’s impressive 22% year-to-date gain has played a pivotal role in pushing the total market capitalization of digital assets above $2 trillion for the first time since April 2022. Both Bitcoin and Ether experienced more than a 1% increase on Thursday with Ether trading at $2,785. The resurgence in Bitcoin’s value can be attributed to various sector-specific factors, including the introduction of US ETFs dedicated to the token. These ETFs, offered by industry giants like BlackRock Inc. and Fidelity Investments, have collectively attracted a net inflow of $3.9 billion since their trading debut on Jan. 11. Additionally, the upcoming Bitcoin halving scheduled for April is expected to reduce the supply of the largest digital asset. Historically, such events have been viewed as supportive factors for price appreciation, further bolstering investor confidence in Bitcoin’s long-term potential.
Between February 7th and February 15th, Bitcoin experienced a notable surge of 21.2%, as traders strive to solidify support around the $52,000 mark. This week’s remarkable upswing is attributed to heightened inflows into spot Bitcoin ETF instruments. However, despite the bullish sentiment in the market, Bitcoin derivatives metrics do not reflect excessive optimism, suggesting that professional traders remain cautious about the sustainability of the current bullish trend. The funding rate for Bitcoin’s perpetual contracts has exhibited a remarkable stability over the past week, maintaining a steady rate of 0.25% per 7 days. This stability suggests a balanced demand and a neutral market sentiment prevailing in the Bitcoin derivatives landscape. In contrast, during late 2023, the same metric soared to 1% per 7 days, signalling a period of excessive optimism among traders. It’s noteworthy that despite the heightened optimism reflected in the funding rate at that time, Bitcoin’s price at year-end remained relatively unchanged compared to the preceding two weeks, hovering around $42,500. Analysis of Bitcoin derivatives indicators reveals a state of moderate bullishness, with no indications of FOMO or the typical utilisation of high leverage, which often characterises periods of reckless trading behaviour. Additionally, bears seem to lack the motivation to suppress Bitcoin’s price, given the consistent influx of funds into spot Bitcoin ETFs. This favourable scenario sets the stage for potential further gains beyond the $52,000 threshold.
Today, Ether has surged by over 3% in the past 24 hours, crossing the $2,800 mark. This upward movement in Ether’s price reflects a 16% increase over the past seven days, mirroring Bitcoin’s uptick of 16.3% during the same period. The rally in Ether can be attributed to several factors, including a decrease in Ether’s supply on exchanges due to stacking activities, accumulation by ETH whales, and growing optimism among both retail and institutional investors. Notably, the supply of ETH staked on the Beacon Chain has reached 30,708,316 ETH, constituting approximately 25.56% of the total current ETH supply. In monetary terms, this amounts to over $86.68 billion, with 31.65% of these staked ETH being facilitated through Lido. Furthermore, Ethereum restaking protocols are witnessing a surge in the number of tokens locked on layer-2 blockchains. The total value locked on Ethereum staking protocol EigenLayer has surged by 33% over the past seven days, reaching $7.09 billion as of Feb. 15. This increase has propelled EigenLayer to claim the third position, surpassing crypto lending protocols like JustLend and Aave in TVL rankings.
The United States government is grappling with an unprecedented level of debt, currently standing at a staggering $34.2 trillion, marking a historic high. Federal Reserve Chair Jerome Powell recently acknowledged the long-term challenges posed by this “unsustainable fiscal path” in a February 4th interview. Projections from the Congressional Budget Office paint a concerning picture, forecasting a nearly 66% surge in the U.S. budget deficit over the next decade, primarily driven by escalating debt-servicing expenses. Further exacerbating the situation, Congress’s independent fiscal watchdog has sounded alarms, predicting that the nation’s total public debt is on track to exceed 100% of the gross domestic product by 2025. This looming milestone raises significant concerns regarding the U.S. dollar’s status as the global reserve currency and the demand for U.S. Treasurys.
Technical Outlook
Bitcoin:
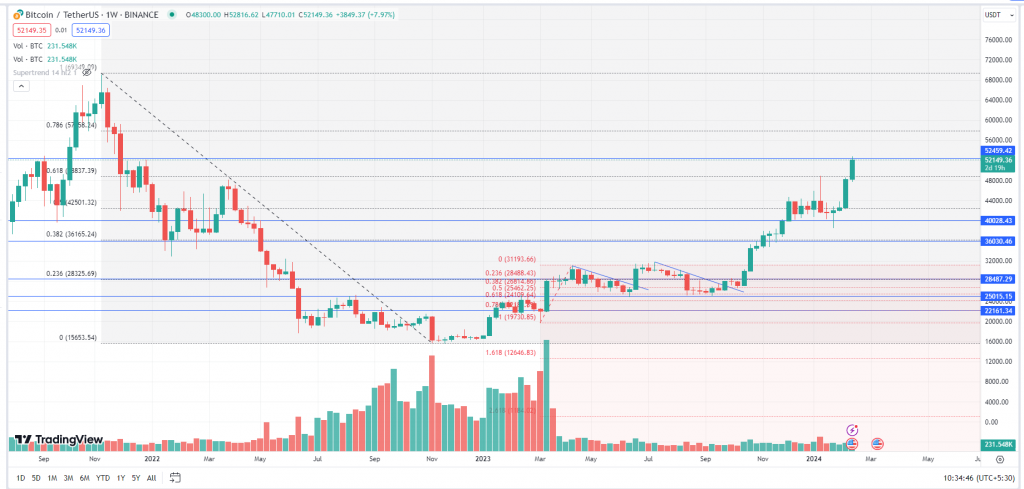
BITCOIN after giving a range breakout above $28,500 witnessed a sharp rally and the prices surged up to $48,969. The asset was facing resistance around $48,000 and corrected to $38,555. Post this move, BTC made a ‘Hammer’ candle at $38,000 and resumed the up move by forming a ‘Higher High Higher Low’ pattern. This week, the bulls successfully broke the resistance of $48,000 and the prices rallied above the $50k mark and made the high of $52,816. Bitcoin can face resistance at $52,500, once it gives a weekly closing above this level then it may further rally up to $60,000 whereas $48,000 will act as a strong support for the asset.
Ethereum:
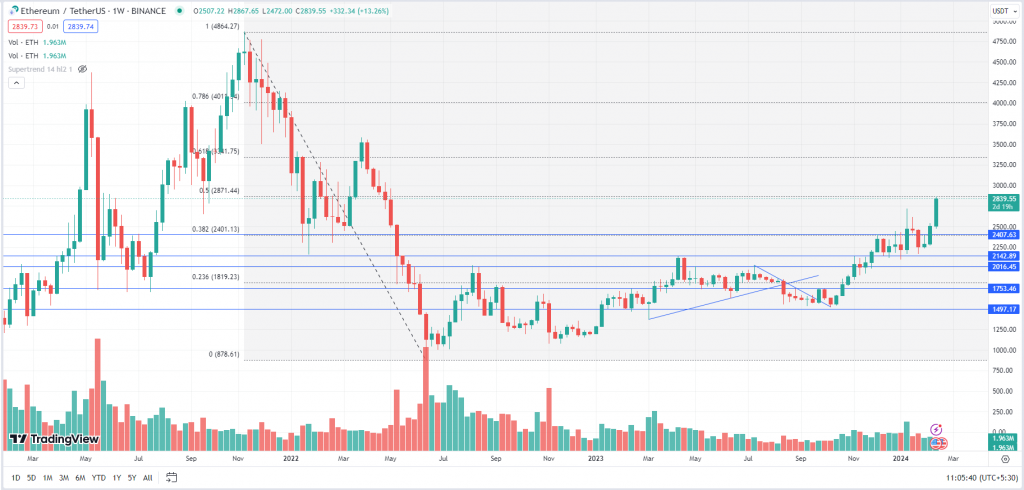
ETH after giving a breakout above the long held resistance of $2,146 rallied up to $2,717. The asset faced stiff resistance at the recent highs and failed to cross the key level of $2,750. The prices witnessed a correction and dropped 20% to $2,168. The asset retested and bounced again from the key level of $2,150 and broke the resistance of $2,750 and made the weekly high of $2,867. ETH may face a resistance at $3,000 whereas $2,750 and $2,400 will act as a strong support for the asset.
BNB:
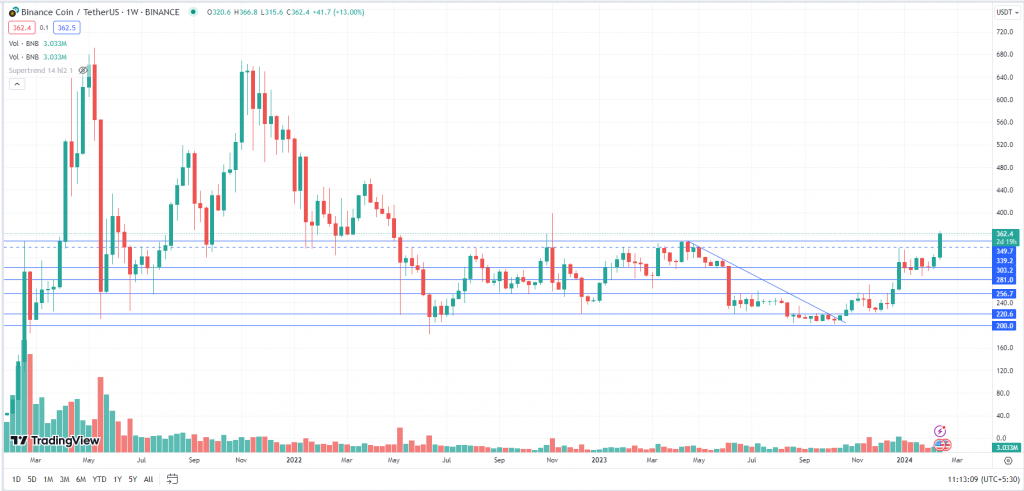
BNB was facing multiple resistance at $255. The bulls finally gave a breakout above the resistance and the prices rallied up to $338. The asset made a ‘Bullish Flag’ pattern and broke the long held resistance of $355. If it holds and sustains above $355 then the prices may further rally up to $380 – $400 levels.
Weekly Snapshot:
| USD ($) | 01 Feb 24 | 18 Feb 24 | Previous Week | Current Week | |||
| Close | Close | % Change | High | Low | High | Low | |
| BTC | $45,302 | $51,939 | 14.65% | $45,576 | $42,265 | $52,820 | $45,261 |
| ETH | $2,420 | $2,824 | 16.69% | $2,460 | $2,270 | $2,866 | $2,419 |
| BNB | $318.87 | $354.71 | 11.24% | $320.41 | $298.21 | $365.13 | $315.93 |
| Crypto | 1w – % Vol. Change (Global) |
| BitCoin (BTC) | 74.93% |
| Ethereum (ETH) | 93.64% |
| Binance Coin (BNB) | 25.39% |
| Resistance 2 | $56,000 | $3,450 | $1.15 | $400 |
|---|---|---|---|---|
| Resistance 1 | $52,500 | $3,000 | $1 | $380 |
| USD | BTC | ETH | Matic | BNB |
| Support 1 | $48,000 | $2,750 | $0.75 | $350 |
| Support 2 | $44,000 | $2,400 | $0.55 | $300 |
Market Updates:
- As much as 20% of Bitcoin’s current hash rate could go offline after the Bitcoin halving — which will see block rewards slashed in half and leave only the most efficient mining rigs standing.
- The Klaytn and Finschia blockchains will merge following overwhelming support for the measure from governance members. The blockchains’ foundations plan to launch an integrated mainnet that could be Asia’s biggest Web3 ecosystem.
- Shares in crypto exchange Coinbase spiked 12.7% following a resilient fourth-quarter earnings report that saw the firm swing to profit and earnings that beat Wall Street expectations.