

Bitcoin and other major crypto tokens continued to weaken on Friday, ahead of a low-volume weekend. Much weighs heavily on Bitcoin, and macroeconomic uncertainty continues to plague traders. Concerns over a debt ceiling easing are also weighing on crypto sentiment. Bitcoin continued to weaken as the largest crypto token tumbled around 2 percent and fell below the $27,000 mark .Ethereum, although down, retreated just over a percent and managed to hold at a level of $1,800. Crypto markets experienced mild selling pressure in the last 24 hours. The Crypto Fear and Greed Index is down 3 points and is currently in neutral territory at 48 points. This indicates excessive caution on the part of investors. With the exception of XRP and USD-pegged stablecoins, all other major crypto tokens traded lower on Friday. The global crypto market cap dropped to $1.12 trillion, and total trading volume fell by as much as 5 percent to $31.91 billion. The technical indicators like RSI and MACD signaled a bear market.
Bitcoin has been trying to break the $27,500 resistance for the past week but could not. One of the reasons Bitcoin’s advantage is being limited is the risk of a possible US default as the government struggles to get the debt limit increased through Congress. Tether’s announcement that it will invest 15% of its monthly operational income in Bitcoin may have accelerated Bitcoin’s rebound. Overall, Bitcoin’s price is up 65% year to date, but it is still down 60% from its all-time high of $69,000 in November 2021. The expectation of another rate hike boosted US Treasury yields, which bolstered demand for the US dollar. If the dollar strength index starts a new bull trend, bitcoin, which normally trades inversely to the greenback, will be jeopardised. The technicals of Bitcoin price chart paint a negative objective of $25,000, a key psychological price level, by June. The bears would argue that Bitcoin is under significant selling pressure as it approaches its 50-day exponential moving average (50-day EMA; the red wave) of $27,670. A move over Bitcoin’s 50-day EMA, on the other hand, could invalidate the bearish scenario, putting BTC on track for $30,000 by June.
On May 17th, the price of Ether fell to a seven-day low of $1,788. The decline in Ether prices comes just one day after Chinese prosecutors threatened to crack down on the NFT sector. Because of the high risk nature of investment, MPs in the United Kingdom have claimed that crypto assets should be regulated like gambling. The rush of Ether liquidations occurs as Ethereum trading volume falls from a peak of $24.8 billion on March 11 to merely $1.9 billion. The significant drop in volume occurs as competing protocols, such as the Bitcoin BRC-20 standard and Dogecoin DRC-20 standard, gain traction. While investor appetites for risky assets and interest in DeFi may continue to wane due to a lack of clarity on regulators’ stance on crypto, the emergence of new blockchains, and lower volume. The eventual rise of protocols based on the Ethereum network could prove to be a long-term catalyst for price growth.
On the macro front, the US Dollar Index, which measures the currency against a basket of currencies, hit a two-month high on May 18, meaning the US currency was appreciating against its global counterparts. This data should not be construed as a vote of confidence in the government’s capacity to prevent a shutdown, as a U.S. debt default would have a detrimental impact on the global economy. While the global economy may worsen in the following months, recent macroeconomic data has been mainly positive, leading the S&P 500 index to post small gains in May, remaining only 13% off its all-time high.
Technical Outlook
Bitcoin:
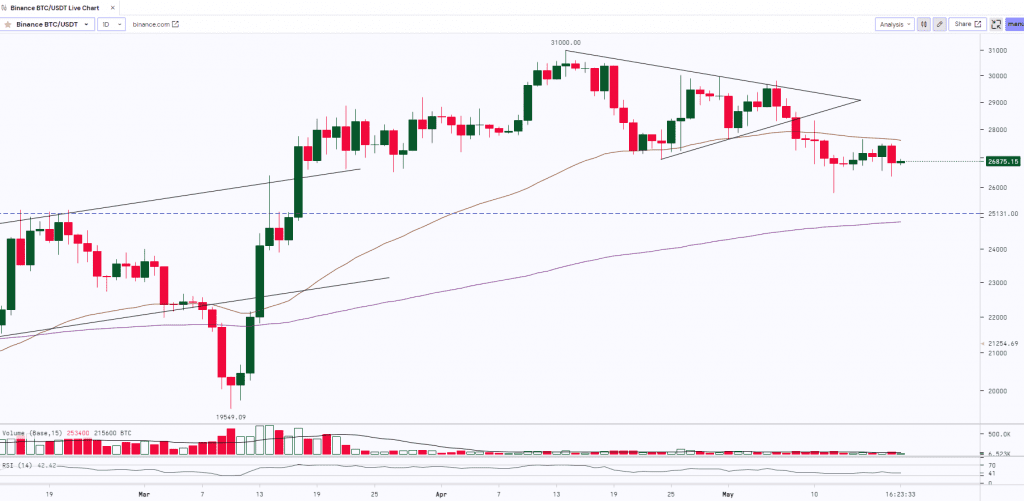
BITCOIN after witnessing a rally from $19,550 to $31,000 was trading in a range forming a ‘Symmetrical Triangle’ pattern with low volumes where the upper downsloping trendline was acting as a resistance and the lower upsloping trendline was acting as a support for the asset. The asset finally gave a breakout on the downside of the pattern and it made a low of $25,811. BTC made a red body ‘Hammer’ candle at the recent low, however, the subsequent candle confirmed a bullish move. Currently, BITCOIN is trading sideways in a range from $26,500 to $27,500. $28,500 and $32,500 will be the major hurdles for the bulls. To witness a rally BITCOIN needs to break, close and sustain above these levels whereas $25k will act as a strong support.
ETH:
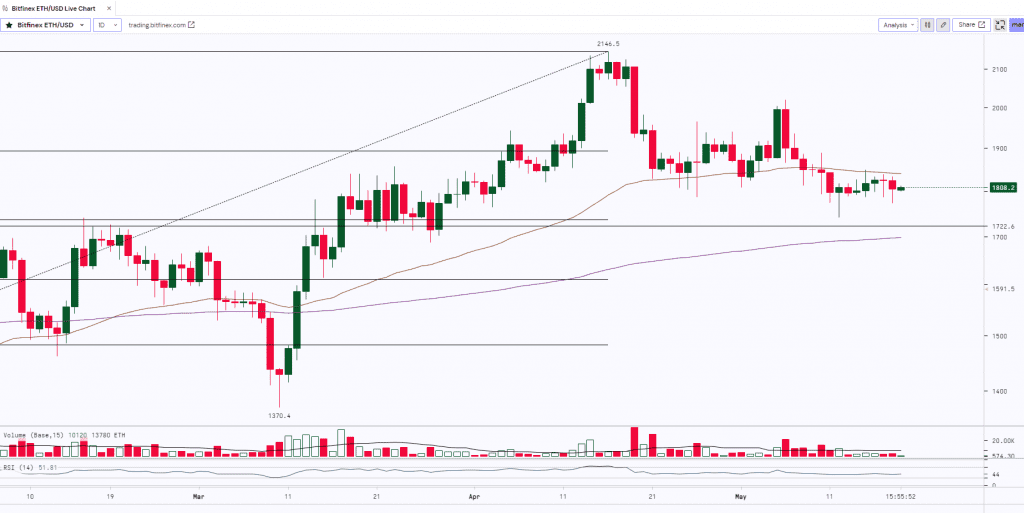
ETH after witnessing a rally from $1,370 to $2,146 started consolidating at the highs and traded sideways making small ‘Spinning Top’ candles that indicated indecision in trend. The bulls failed to manage the grip on the asset as it saw some profit booking and the prices dropped to $1,741.5. ETH made a ‘Hammer’ candle at the recent low where the lower longer shadow indicates buying around the support zone ($1,700- $1,725). Currently on the daily time frame, ETH is consolidating and trading sideways and is resisting at its 50 Day Moving Average with low volumes.
BNB:
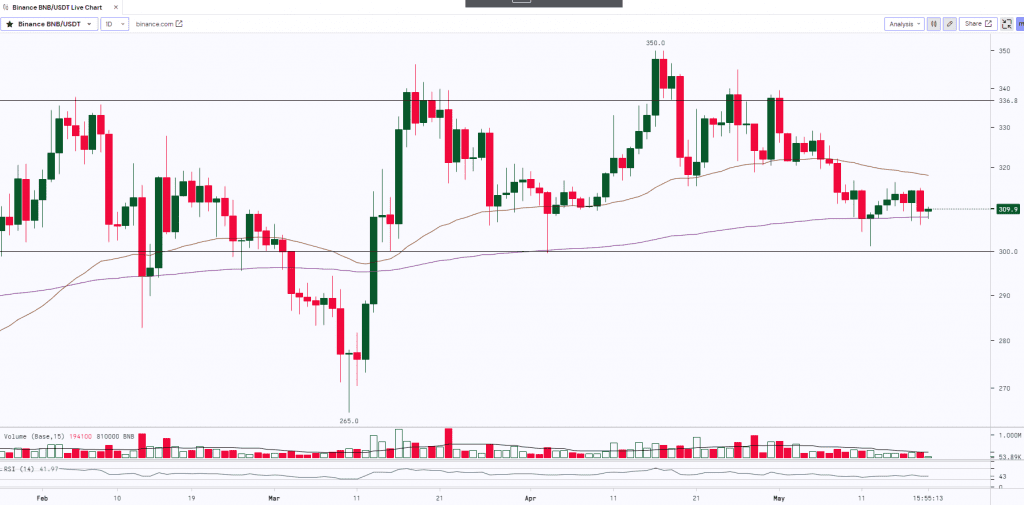
BNB after making a high of $350 made a ‘Tweezer Top’ Candles witnessed a profit booking and the prices plunged to $315. The asset was taking support at its 50 Day Moving Average. However, BNB broke the support and closed below its 50 Day Moving Average and witnessed further downfall making the weekly low of $301.2. The asset has a strong support at $300. If it sustains and holds above the support then we may expect some rally whereas a break below this will lead to further downfall. Currently, BNB is trading sideways in a range from $301 to $315.
Monthly Snapshot:
| USD ($) | 11 May 23 | 18 May 23 | Previous Week | Current Week | |||
| Close | Close | % Change | High | Low | High | Low | |
| BTC | $27,000 | $26,832 | -0.62% | $29,820 | $26,781 | $27,646 | $25,878 |
| ETH | $1,796 | $1,802 | 0.32% | $2,017 | $1,774 | $1,846 | $1,742 |
| BNB | $307.70 | $309.46 | 0.57% | $328.90 | $304.96 | $316.37 | $301.58 |
| Cryptocurrency | 1w – % Vol. Change (Global) |
| BitCoin (BTC) | -16.36% |
| Ethereum (ETH) | -29.10% |
| Binance Coin (BNB) | -17.43% |
| Resistance 2 | $32,500 | $2,250 | $1.30 | $350 |
|---|---|---|---|---|
| Resistance 1 | $28,500 | $2,000 | $0.95 | $336 |
| USD | BTC | ETH | Matic | BNB |
| Support 1 | $25,000 | $1,700 | $0.75 | $300 |
| Support 2 | $22,000 | $1,500 | $0.63 | $255 |
Market Updates:
- Crypto trading platform Coin Cafe has been ordered to repay $4.3 million to its users after allegedly charging “exorbitant and undisclosed fees” for storing Bitcoin on the platform — leading to some accounts being drained entirely of its funds.
- The United States Securities and Exchange Commission (SEC) has asked Grayscale Investments to pull its application for a Filecoin Trust, warning that its underlying asset, Filecoin can be seen as a security.
- Australia has successfully made its first foreign exchange transaction using eAUD as part of a live pilot for the country’s potential central bank digital currency.

