
21 September 2022 | ZebPay Trade-Desk
The moving average is a stock market indicator commonly used in technical analysis that helps create a constantly updated average price. A clear understanding of the moving average (MA) is crucial to better understand the Golden Cross and Death Cross. MAs are generally calculated to determine the direction of an asset’s trend or to identify its support and resistance levels. The MA is a technical indicator related to the average price of a specific asset over a defined time. MA indicates whether the asset is in an uptrend (positive, up) or a downtrend (negative, down). MAs provide useful signals when trading Crypto charts in real-time. They can also be set to different periods, e.g. periods of 10, 20, 50, 100 or 200 days. Such periods highlight market trends and make them easily recognizable. Traders also use different types of MAs. The first is the simple moving average (SMA), which calculates the average price of an asset over a given period divided by the total number of periods.
For Example: If an investor wants to calculate the SMA of ETH using its closing prices over the last few days, the calculation will look like this:
SMA= (P1+ P2+ P3+ P4+ P5)/5
We are taking the closing price of ETH from September 16th to 20th 2022, the SMA for the 5-day period would be as follows:
SMA = ( 1,324.39+ 1,377.54 + 1,335.33 + 1,469.74 + 1,432.45) = 6,939.45
Another is the weighted moving average which, as the name suggests, gives more weight to recent prices. As a result, the value better reflects recent market changes. An exponential moving average, on the other hand, while giving more weight to recent prices, does not remain consistent with the rate of decline between a given price and the previous price.
Moving averages, also called “indicators”, are based on “lagging behind” at historical prices. Traders use MA assignments to guide them in buying and selling assets, with the 50 and 200-day timeframes being the most closely watched among Crypto traders.
Golden Cross:
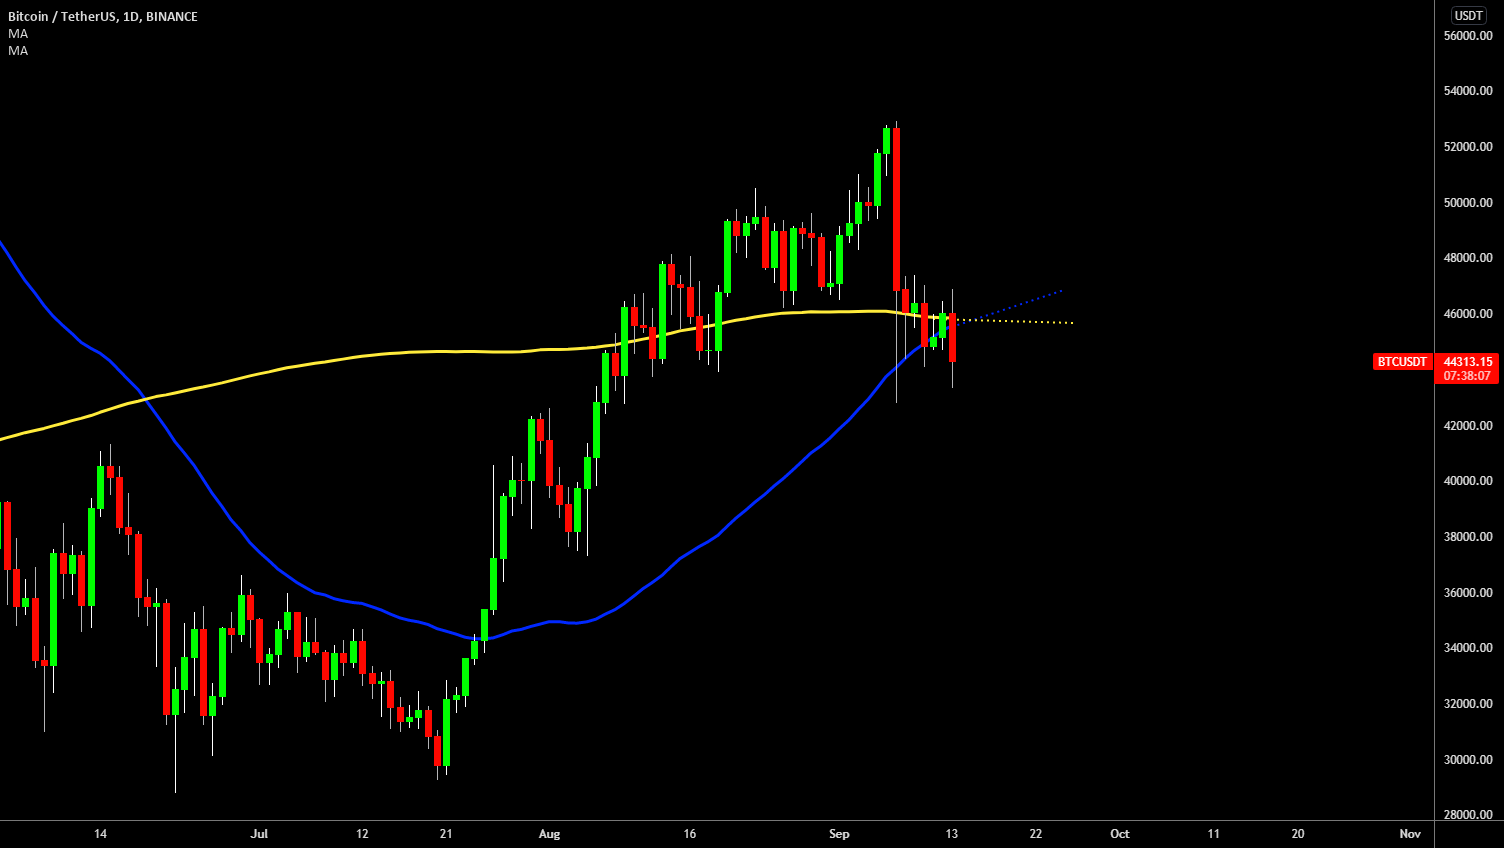
A “Golden cross” occurs when a short-term moving average and a major long-term moving average cross to the upside. A gold cross indicates a price increase and a bullish market reversal. The short-term MA moves up much faster than the long-term MA until market conditions push it down. In simple moving averages, golden crosses occur when the 50-day SMA crosses above the 200-day SMA, indicating a clear uptrend.
The formation of a Golden cross usually has three stages.
- When selling is exhausted, it usually marks the end of a downtrend and thus the beginning of a golden cross.
- The next stage is when the short-term MA crosses the long-term MA.
- The third is a sustained uptrend which usually results in higher prices.
No two gold crosses are identical, but these three phases are often the distinctive events that mark the appearance of a golden cross. Let’s take a closer look at each phase.
During the first phase, buyers take control of a downtrend. The short-term weakness of the 50-day moving average signals the beginning of a golden cross. This is because the resultant force usually comes from buyers beginning to take control while short-term sellers run out of steam. A flattening occurs on the chart, with buyers pushing prices soaring trying to gain control. The resulting momentum is gradually pushing the 50-day MA through the 200-MA, at which point the two periods intersect. Typically, when the 50-day moving average crosses over the 200-day moving average, traders go on high alert to determine if an uptrend is underway or if it’s just a false positive. The final phase occurs as the 50-day moving average continues to push up, indicating its momentum. This too often leads to overbought, albeit in brief bursts.
Death Cross
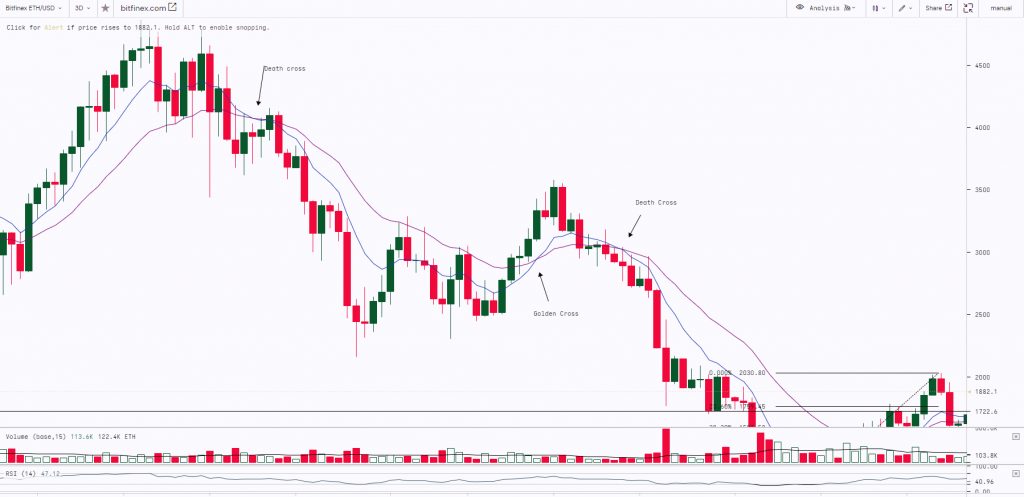
Put simply, Death Cross is the exact opposite of the golden cross. A death cross is generally read as a retrograde signal. The 50-day moving average usually crosses the 200-day moving average, indicating a downtrend. Three phases mark a death cross.
- The first occurs during an uptrend when the short-term moving average is still above the long-term moving average.
- The second phase is characterized by a reversal, during which the short-term moving average crosses below the long-term moving average.
- This is followed by the start of a downtrend as the short-term moving average continues to move lower and stays below the long-term moving average.
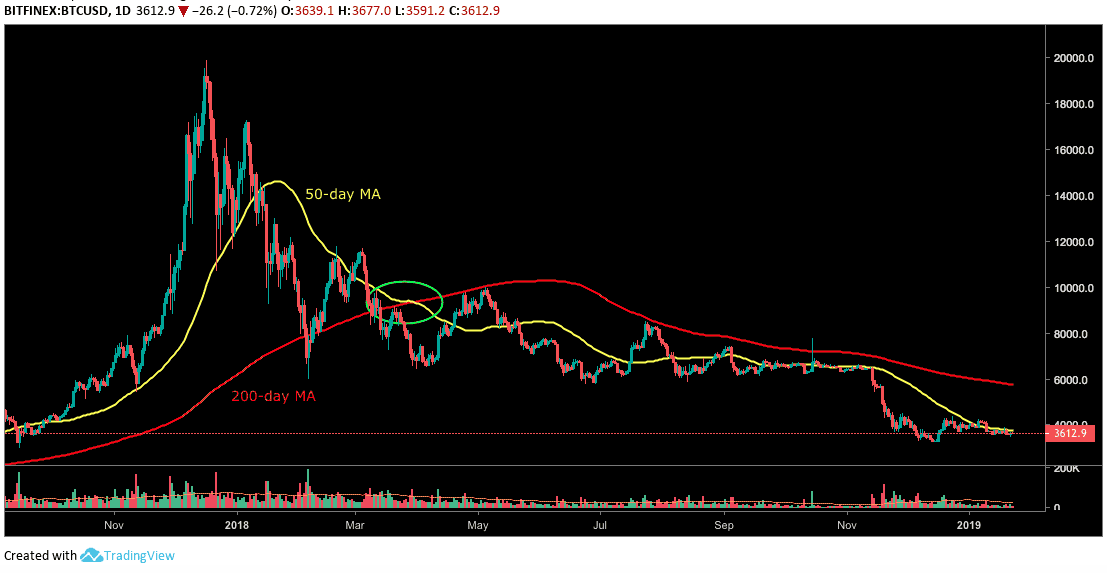
Like the Golden Cross, no two Death Crosses are similar, but specific markings mark their appearance. Here’s a detailed look at each stage of a death cross. The first phase of a death cross is usually marked by the uptrend in an asset. This is followed by a weakening 50-day moving average, the first sign that a downtrend may be in the making. When prices start falling after the peak, the short-term MA diverges from the long-term MA.
In the second phase, the 50-day moving average falls below the 200-day moving average. This is a crucial point as it suggests that the asset may be starting a downtrend. The divergence between the two MAs will become more apparent as prices continue to fall. The cross of death begins to form much more clearly at this stage. The final leg is marked by the 50-day MA, which continues to trend down and holds below the 200-day MA. This indicates that a downtrend is indeed underway. The death cross usually leads to increased selling pressure as traders liquidate their positions in anticipation of further price declines. However, if the downtrend does not continue, it could mean a short-lived momentum and prices will rise quickly, in which case the death cross is considered a fake signal.
What can we infer from the Golden Cross and the Death Cross
As mentioned, the two are essentially opposites in terms of how they appear on the chart and what they display. Since MAs are lagging indicators, both crossovers serve only to confirm the occurrence of a trend reversal, not to predict it. Therefore, they should be used in conjunction with other technical indicators to better understand market conditions.
The Golden Cross and Death Cross are usually confirmed by high trading volume. Other technical indicators that analysts can watch are the moving average convergence divergence and the relative strength index. Death crosses usually signal the start of a long-term bear market, not just in crypto but in stock markets also. The death cross has historically heralded the arrival of major economic crises, such as the 1929 Black Monday stock market crash and the 2008 financial crisis. However, death crosses can also give false signals and are not 100% accurate. For example, there have been instances where markets have bounced back after a death cross. On the other hand, gold crosses signal the arrival of a long-term bull market. But despite their apparent ability to predict previous major bull runs, gold crosses can also generate false signals.
Different traders have different approaches to cross signals. Some traders may wait for a confirmed Golden or Death Cross before entering or exiting a trade. Others may use the crossovers as confirmation signals in conjunction with other technical indicators. In general, however, the golden and death crosses can be used as trend reversal signals. If a trader sees a gold cross forming, they could buy an asset before prices go up. Similarly, if a trader sees a death cross forming, they could sell an asset in anticipation of falling prices. Of course, it is always important to be cautious when trading crossed signals. As mentioned earlier, false signals do occur and it is important to confirm any cross-signals with other technical indicators before taking a position.
Skilled traders also know to look at the bigger picture and consider multiple metrics. For example, a gold cross may occur in a one-hour time frame, but zooming out to view the daily or weekly time frame may reveal that a death cross is actually at play. Trade volume is also something to consider when trading cross signals as spikes in volume may very well confirm or negate the validity of a signal.Disclaimer : This report is not intended to be relied upon as advice to investors or potential investors and does not take into account the investment objectives, financial situation or needs of any investor. All investors should consider such factors in consultation with a professional advisor of their choosing when deciding if an investment is appropriate. The Company has prepared this report based on information available to it, including information derived from public sources that have not been independently verified. No representation or warranty, express or implied, is provided in relation to the fairness, accuracy, correctness, completeness or reliability of the information, opinions or conclusions expressed herein. This report is preliminary and subject to change; the Company undertakes no obligation to update or revise the reports to reflect events or circumstances that arise after the date made or to reflect the occurrence of unanticipated events. Trading & Investments in cryptos viz. Bitcoin, Bitcoin Cash, Ethereum etc.are very speculative and are subject to market risks. The analysis by Author is for informational purposes only and should not be treated as investment advice.

