
The price of Ether faced challenges as it dropped below the crucial support level at $1,626 on September 1st. Despite attempts by the bulls to initiate a rebound, they are struggling to gain momentum, indicating a lack of demand at higher price levels. Additionally, the moving averages are sloping downwards, and the RSI is in negative territory. These technical indicators suggest that the bears are still in control of the Ethereum market.
At the time of writing, ETH was trading at $1,623.
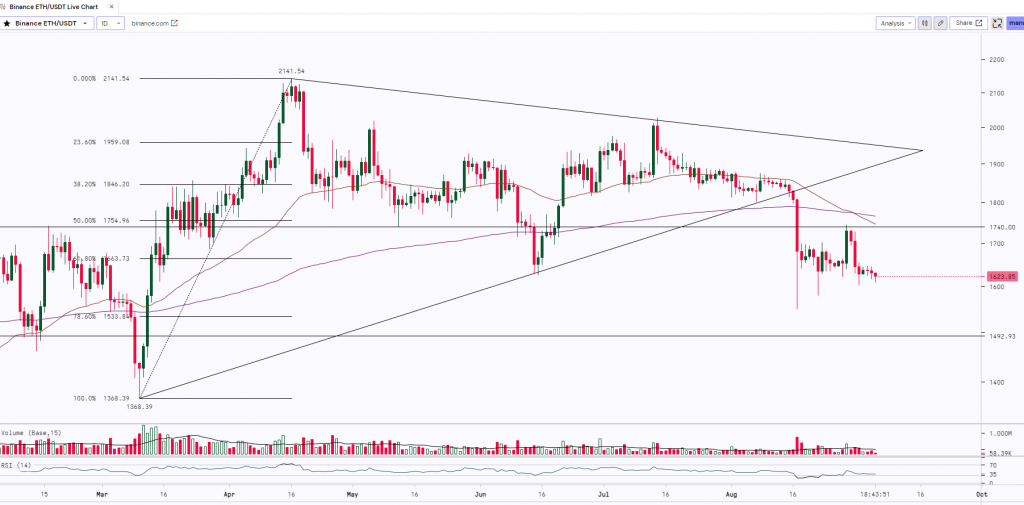
ETH after surging 49% from $1,368 to $2,041 started trading in a broad range making a ‘Symmetrical Triangle’ pattern where the lower uptrend line was acting as a support and the upper downtrend line was acting as a resistance. ETH finally gave a breakout on the downside of the range and the prices reached a low of $1,550 and started consolidating between $1,700 to $1,625. ETH did break the range on the upside and rallied up to $1,745. However, it failed to breach the resistance level of $1,750 (Horizontal Trendline) and the prices dropped to $1,630. ETH has a strong support zone from $1,535 to $1,500 (Horizontal Trendline & 78.6% Fibonacci Retracement Level).
Key Levels:
| Support 2 | Support 1 | Asset | Resistance 1 | Resistance 2 |
| $1,350 | $1,500 | ETH | $1,750 | $2,150 |