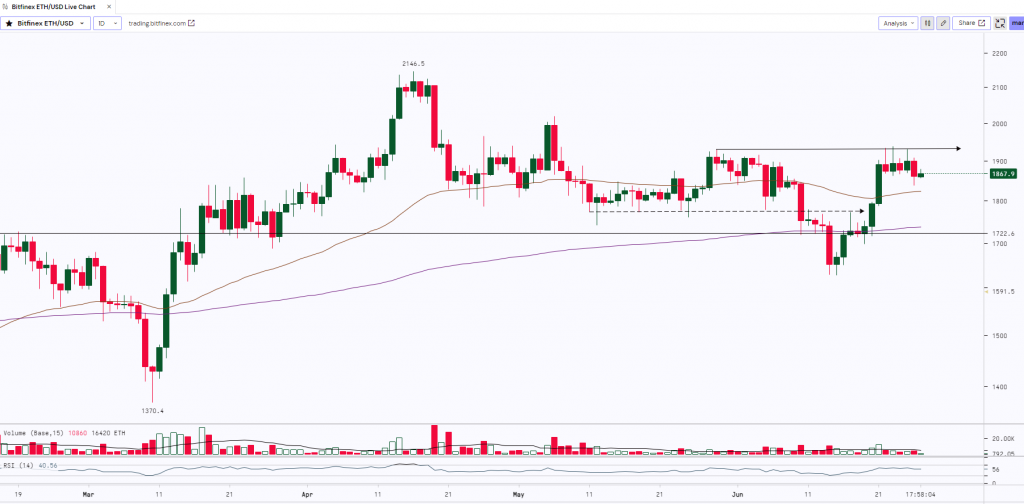
Ether has been trading in a tight range between $1,936 and $1,861 for the past few days. This indicates indecisiveness between bulls and bears. The rising 20-day EMA ($1,822) and the RSI in the positive territory are suggesting that the bulls have the upper hand. ETH inflows surged to $7.8 million on Bitcoin’s rise. Ether is showing signs of bullish movement. Data from Glassnode shows that ether balances on exchanges have plummeted over the past 30 days, hitting a new low of 12.6%. November 2022 saw a similar fall in ether exchange holdings, followed by a strong 33% rally.
At the time of writing, ETH was trading at $1,868.

ETH after making the recent top of $2,146 (on 16th April 2023) was trading in a downtrend and the prices corrected almost by 24% and made a low of $1,628.3. Post this move, the asset made a ‘Bullish Harami’ pattern at the low and has started moving upwards. ETH witnessed a sharp rally and surged 19% up to $1,938. Currently, the asset is consolidating and trading in a range from $1,850 to $1,900. ETH has a strong resistance at $1,950 and to further rally, it needs to break and close above the resistance whereas $1,775 to $1,750 will act as a strong support zone for the asset.
Key Levels:
| Support 2 | Support 1 | Asset | Resistance 1 | Resistance 2 |
| $1,610 | $1,750 | ETH | $1,950 | $2,150 |

