

SOL has a market cap of $45.23 billion, as of date, while the total crypto market cap stands at $2.22 trillion.
The Solana community lead has entered the UK by-election with a focus on on-chain transparency. Japanese financial giant SBI Holdings has partnered with the Solana Foundation to build an on-chain financial market in Japan.
On the daily chart, Solana is currently trading around $77.88. The crypto market witnessed a sharp recovery yesterday, with SOL also finding support in the $73-$75 zone. Positive news continues to build, while on-chain activity is also increasing. However, the chart still suggests resistance at higher levels.
Technical Chart of SOL
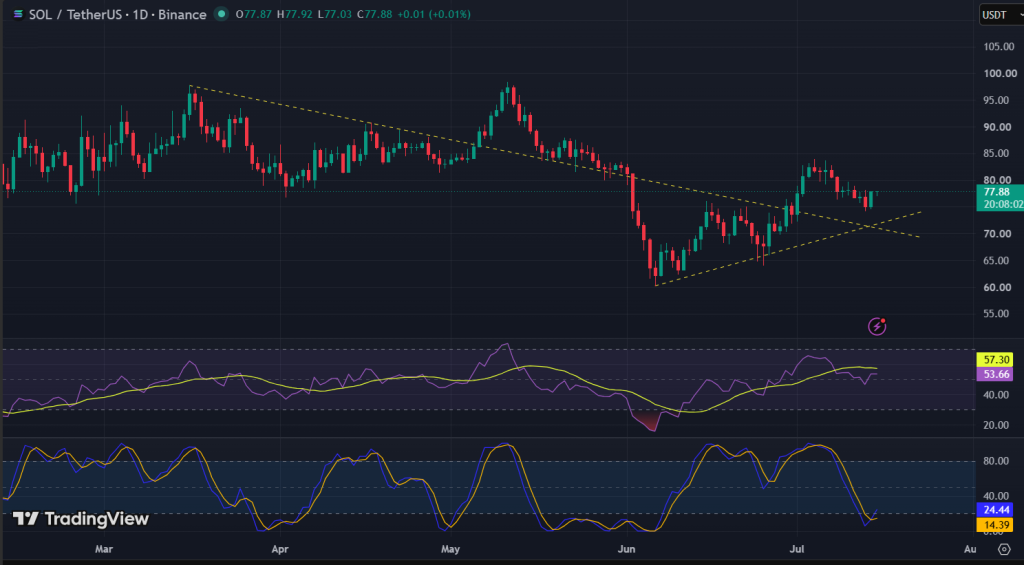
On the daily chart, SOL is trading above its 14-period and 21-period Simple Moving Averages (SMAs) at $76.48 and $76.46, respectively, indicating a supportive trend.
On the daily chart, the Relative Strength Index (RSI) is at 53.66, while the Stochastic Oscillator is at 24.44, indicating that the Stochastic is approaching the oversold zone, while the RSI remains above the neutral level. Overall market sentiment is still weak, and profit booking at higher levels is likely to continue.
Also Read: Are SpaceX, OpenAI, and Anthropic’s IPOs Draining Bitcoin Liquidity?
Support and Resistance Levels
| Support 2 | Support 1 | Asset (Price) | Resistance 1 | Resistance 2 |
| $73.25 | $67.70 | SOL ($77.88) | $81.85 | $85.25 |
Above $85.25, there’s a possibility of hitting the $89 levels.
In the grand scheme of things, ZebPay blogs are here to provide you with crypto wisdom. Get started today and join 6 million+ registered users to explore endless features on ZebPay!