SOL: Solana is a highly functional open-source project that banks on blockchain technology’s permissionless nature to provide decentralized finance (DeFi) solutions. While the idea and initial work on the project began in 2017, Solana was officially launched in March 2020 by the Solana Foundation with headquarters in Geneva, Switzerland.
The Solana protocol is designed to facilitate decentralized app (DApp) creation. It aims to improve scalability by introducing a proof-of-history (PoH) consensus combined with the underlying proof-of-stake (PoS) consensus of the blockchain.
SOL has a Market Cap of $49.10Bn as of the date, and Crypto Market Cap is at $2.57T.
On the daily chart, SOL is currently trading around $84.78 after correcting sharply from the $250+ zone over the past year. Following an extended consolidation phase, the price is now showing signs of strength near the bottoming region, indicating a potential bullish reversal. If momentum sustains, SOL could soon reclaim triple-digit territory in the coming sessions.
Technical Chart of SOL
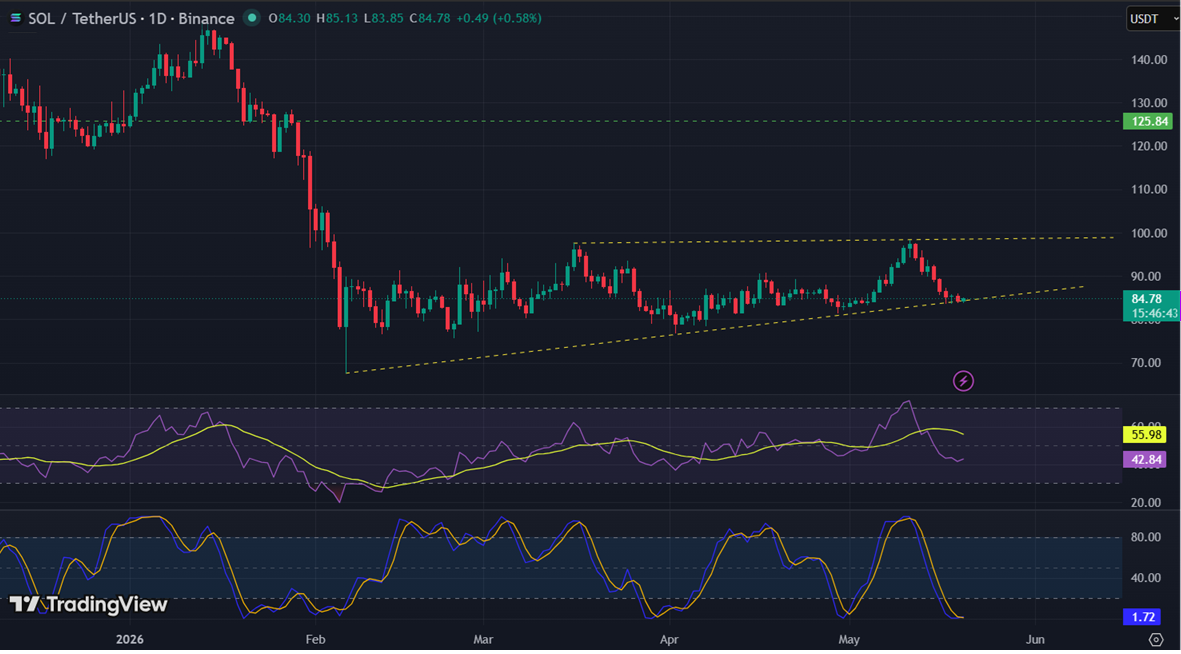
Image Source: TradingView
On the Daily Chart, SOL price is trading below its Simple Moving Average (14 & 21 periods) levels of $87.707 & $87.503 and will act as a small resistance in the coming sessions.
On the Daily Chart, the Relative Strength Index (RSI) is at 42.84, and the Stochastic is at 1.72, indicating an oversold zone and RSI shifting to the positive zone and potential positive trend.
Support and resistance levels:
| Name | Price | Support 1 | Support 2 | Resistance 1 | Resistance 2 |
| SOL | 84.78 | 75.20 | 67.84 | 99.32 | 116.84 |
Above $116.84 possibility of hitting the $132 levels.