
Here is a technical analysis of ETH/USDT on a daily timeframe:
Market Overview
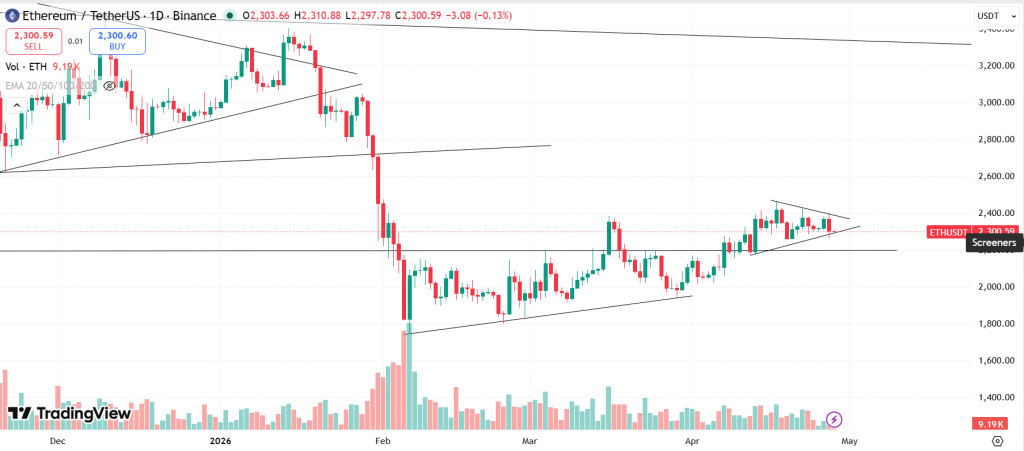
Ethereum is currently trading around $2,300 and continues to move in a recovery phase after the sharp fall seen earlier this year. The market has improved compared to February-March, but it is still not in a confirmed bullish trend. What we are seeing right now is a slow grind upward with repeated resistance, not a strong breakout. The broader structure remains cautious, with buyers trying to gain control but not fully succeeding yet.
Recent Price Action
In the past couple of weeks, ETH has been forming a series of higher lows, which is a positive sign and shows gradual strength building in the market. However, at the same time, the price is struggling to break above the $2,350–$2,400 zone, which has acted as strong resistance multiple times. Recently, ETH attempted another move toward this area but faced rejection again and is now consolidating just below it. This kind of behavior clearly shows that while buyers are active, sellers are still aggressively defending higher levels.
Also Read: What are Blockchain Oracles?
Current Structure and Trend
The current structure can be described as mildly bullish in the short term but neutral overall. The rising trendline from the $1,800 bottom is still intact, supporting the price and preventing deeper drops. On the other hand, there is also a short-term descending resistance trendline forming near the recent highs, which is capping the upside. This creates a compression zone where the price is getting squeezed between support and resistance. Such setups usually lead to a breakout, but the direction is not confirmed yet.
Key Levels to Watch
The most important resistance remains $2,350–$2,400. A clean breakout and hold above this zone are required for ETH to gain real bullish momentum and potentially move toward $2,600–$2,800. On the downside, $2,200 is acting as immediate support, followed by $2,000, which is a strong psychological and structural level. If ETH drops below $2,200, it may revisit the $2,000 zone, and losing that would significantly weaken the current recovery structure.
Also Read: Long/Short Trading Strategy: What, How & Why?
Volume and Momentum
Volume continues to remain relatively low compared to the heavy selling phase seen in February. This is an important detail because it tells us that the current upward movement is happening without strong conviction. There is no aggressive buying yet, which is why the price is moving slowly and struggling at resistance levels. Momentum is present, but it is not strong enough to confirm a trend reversal.
At the time of writing, ETH was trading at $2,300.
Summary
Ethereum is showing gradual improvement, but the market is still lacking strong bullish confirmation. As long as ETH stays above $2,200, the short-term structure remains stable. However, for a real trend shift, the price needs to break and sustain above the $2,400 resistance zone with strong volume. Until that happens, this remains a slow recovery within a larger uncertain trend, where both upside continuation and downside pullback are still possible.
Key Levels
| Support 2 | Support 1 | Asset | Resistance 1 | Resistance 2 |
| $2,000 | $2,200 | ETH | $2,400 | $2,700 |
In the grand scheme of things, ZebPay blogs are here to provide you with crypto wisdom. Get started today and join 6 million+ registered users to explore endless features on ZebPay!