
Here is a technical analysis of ETH/USDT on the daily timeframe:
Market Overview
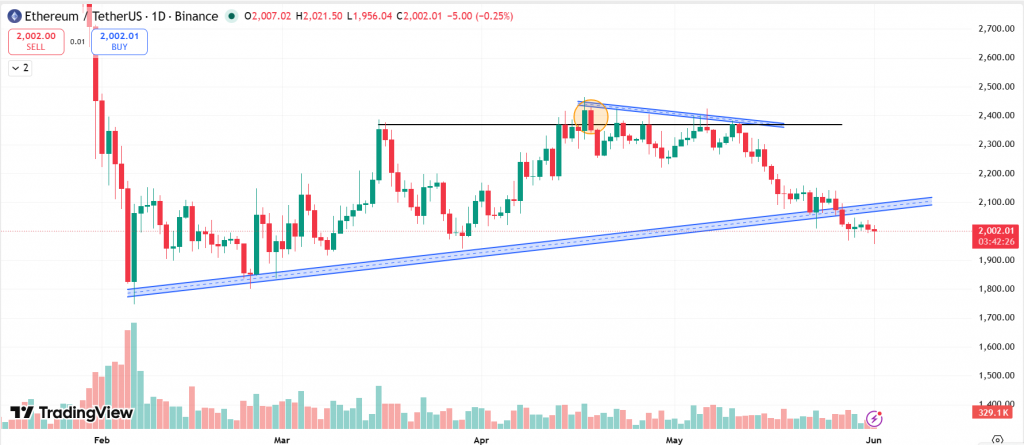
Ethereum (ETH/USDT) is currently trading around $2,000 on the daily timeframe after breaking below the ascending trendline support that had guided price action since the February lows. The breakdown of this structure signals a notable shift in market sentiment, from medium-term bullish consolidation to a more cautious and bearish outlook.
The previous support trendline, which acted as a foundation for higher lows throughout March, April, and May, has now been breached. This breakdown indicates that buyers are losing control, while sellers have gained short-term momentum.
Recent Price Action
ETH spent most of April and May consolidating between the $2,350–$2,400 resistance zone and the rising trendline support. A key rejection occurred near $2,400, where the price formed a lower high beneath the descending resistance trendline. This rejection confirmed the presence of strong overhead supply and prevented a bullish breakout.
Following the rejection, Ethereum gradually declined and eventually broke below the ascending support channel around $2,050–$2,080. The breakdown was followed by continued selling pressure, which pushed the price toward the psychological $2,000 support area. The market is currently attempting to stabilize near this major support zone after a sustained decline.
Also Read: Top 10 Cryptos to Invest in June 2026
Current Structure and Trend
The overall market structure has weakened significantly compared to the previous report. Key observations:
- The ascending support trendline has been decisively broken.
- Lower highs continue to form beneath the major resistance zone.
- Price is now trading below the former trend support.
- Market structure has shifted from bullish consolidation to a bearish correction.
The current technical picture suggests:
- Sellers have gained short-term control.
- Buyers must defend the $2,000 psychological support level.
- Failure to hold above $2,000 could accelerate downside momentum toward lower support levels.
- The former ascending trendline may now act as dynamic resistance if ETH attempts a recovery rally.
Volume and Momentum
Volume remains relatively moderate during the recent decline, suggesting that the breakdown is occurring through persistent selling rather than panic liquidation. Momentum has clearly weakened over the past several weeks:
- Repeated failures near $2,400 have exhausted bullish momentum.
- The trendline breakdown confirms increasing bearish pressure.
- Recovery attempts have been limited and have been quickly sold into.
For momentum to improve, ETH would need to reclaim the broken trendline and establish sustained trading above the $2,100–$2,150 region. Until then, sellers maintain the technical advantage.
At the time of writing, ETH was trading at $2,002.
Summary
Ethereum is currently trading near $2,000 after breaking below the ascending support trendline that had supported the market since February. The rejection from the $2,350-$2,400 resistance zone and the subsequent trendline breakdown indicate weakening bullish momentum and increasing seller control.
While the $2,000 psychological level remains an important support area, the broader structure has shifted toward a bearish correction. Buyers must quickly reclaim lost ground to prevent further downside toward the $1,900 and $1,800 support zones. The coming sessions will likely determine whether ETH can stabilize and recover or continue its decline toward lower support levels.
Also Read: 10 Best Cryptos to Buy Under $1 in June 2026
Support and Resistance Levels
| Support 2 | Support 1 | Asset | Resistance 1 | Resistance 2 |
| $1,800 | $1,900 | ETH | $2,100 | $2,350 |
In the grand scheme of things, ZebPay blogs are here to provide you with crypto wisdom. Get started today and join 6 million+ registered users to explore endless features on ZebPay!