



SOL has a market cap of $56.68 billion, as of date, and the crypto market cap is at $2.66 trillion:
- Solana to Host Community Call on August 27.
- Solana Real-World Asset Holders Top 300,000 as DeFi TVL Rises to $10.7 Billion.
- Solana Transactions Hit a Record 4.2 Billion as SOL Rallies 40%.
- Solana Outpaces Bitcoin as Record $1.2B ETF Inflows.
- Solana Governance Proposals Enter On-Chain Vote, with Deadline Set for August 26.
- Solana Cuts Mainnet Slot Time to 350 Milliseconds.
On the daily chart, Solana (SOL) is currently trading around $97.12. Last week, SOL took support from its rising trendline and broke above the key resistance level of $78, triggering a strong rally toward the $103 level. SOL outperformed several other major crypto assets during the move, supported by renewed ETF inflows and a positive response from investors.
However, after such a strong rally, the market may pause or consolidate before making its next directional move. If SOL sustains above the $101 level, it could attract fresh buying interest in the coming days and potentially resume its upward momentum. Overall, the outlook remains positive as long as SOL holds above the key support zone, with $101 acting as an important level for further bullish momentum.
Also Read: 10 Cryptos to Buy Under $1 in August 2026
Technical Chart of SOL
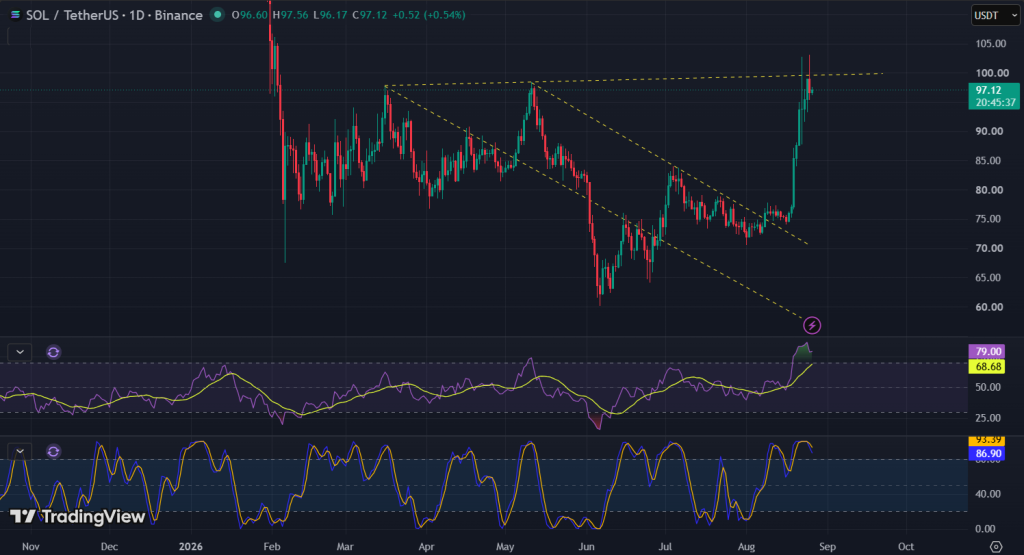
On the daily chart, SOL price is trading above its Simple Moving Average (14 & 21 periods) levels of $83.79 & $81.42, indicating support for the price. On the daily chart, the RSI is at 79 and sustaining above the 70 level, indicating strong bullish momentum. However, a decline below the 70 level could signal weakening momentum and increase the possibility of short-term profit booking.
The Stochastic Oscillator is at 86.90, placing it in the overbought zone and suggesting that the market could witness short-term profit booking or consolidation before the next directional move. However, overbought readings can persist during strong uptrends, so they should be interpreted alongside price action and key support levels. Overall, momentum remains strongly bullish, but traders should remain cautious at higher levels and watch for any sustained decline in RSI below 70 as an early indication of weakening momentum.
Support and Resistance Levels
| Support 2 | Support 1 | Asset (Price) | Resistance 1 | Resistance 2 |
| $92.15 | $86.90 | SOL ($97.12) | $103.30 | $112.60 |
Above $112.60, there’s a possibility of hitting the $123.60 levels.
In the grand scheme of things, ZebPay blogs are here to provide you with crypto wisdom. Get started today and join 6 million+ registered users to explore endless features on ZebPay!