




Bitcoin started the week with strong buying interest and continued its bullish momentum, breaking above the key $80,000 psychological resistance level and reaching a high of around $81,455. The rally extended the sharp recovery from the $62,000 area, with BTC gaining more than 23% during the previous weekly move. Strong institutional demand through spot Bitcoin ETFs, improving liquidity expectations, and short covering remained key drivers of the rally.
During the week, U.S. spot Bitcoin ETFs continued to attract strong inflows, with approximately $1.12 billion in net inflows recorded last week, further supporting positive market sentiment and BTC’s upward momentum. BTC is currently trading around $77,647 and remains in the bullish zone following the strong weekly recovery. However, traders should closely watch the $80,000–$82,000 resistance zone. Holding above the $74,000–$75,000 support zone would keep the broader bullish structure intact, while a sustained breakout above $82,000 could provide fresh buying momentum and support further upside.
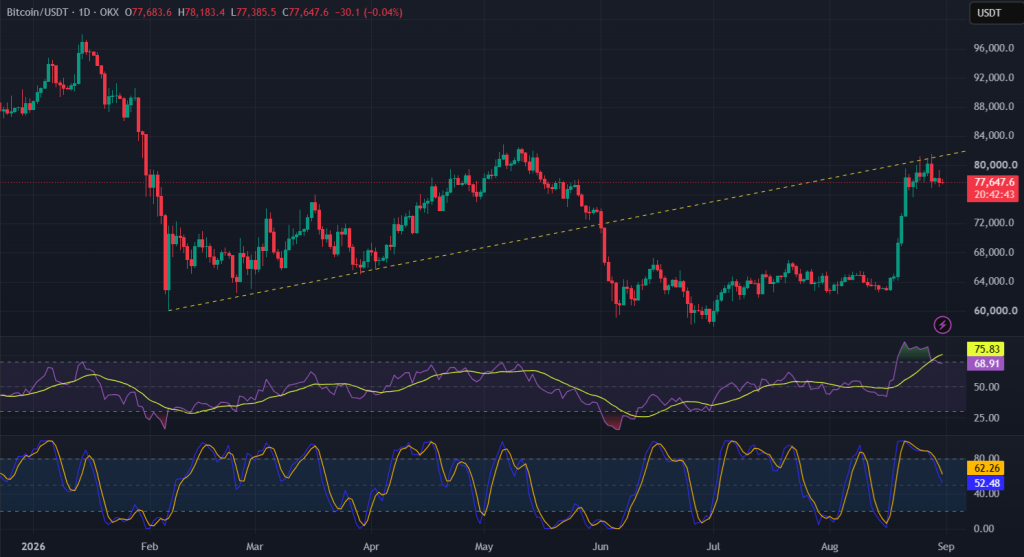
On the Daily Chart, BTC is trading above its 14-period and 21-period Simple Moving Averages (SMA) at $72,411 and $70,427, respectively, indicating that both moving averages continue to provide support and the broader price structure remains positive. The RSI is at 68.91, indicating that bullish momentum is still present but is beginning to lose strength. The RSI is approaching the 70 level, so it will be important to watch whether it can sustain above 70 to confirm renewed bullish momentum. A decline from current levels could indicate increasing profit booking or short-term selling pressure.
The Stochastic Oscillator is at 52.48, showing that momentum has cooled significantly from the previous overbought conditions. This suggests that some profit booking has already taken place and the market may be entering a consolidation or re-accumulation phase before the next directional move. Overall, BTC remains technically positive while trading above its key SMA support levels, but momentum indicators suggest some cooling in the short term.
Also Read: India Gears Up for its First Tokenised Corporate Bond
Key Levels
| Support 2 | Support 1 | Asset (Price) | Resistance 1 | Resistance 2 |
| $74,800 | $72,240 | BTC ($77,350) | $81,200 | $84,480 |
Above $84,480, there’s a possibility of hitting the $89,235 level.
Unravel everything that you need for your crypto journey via ZebPay blogs. Get started today and join 6 million+ registered users on ZebPay!