

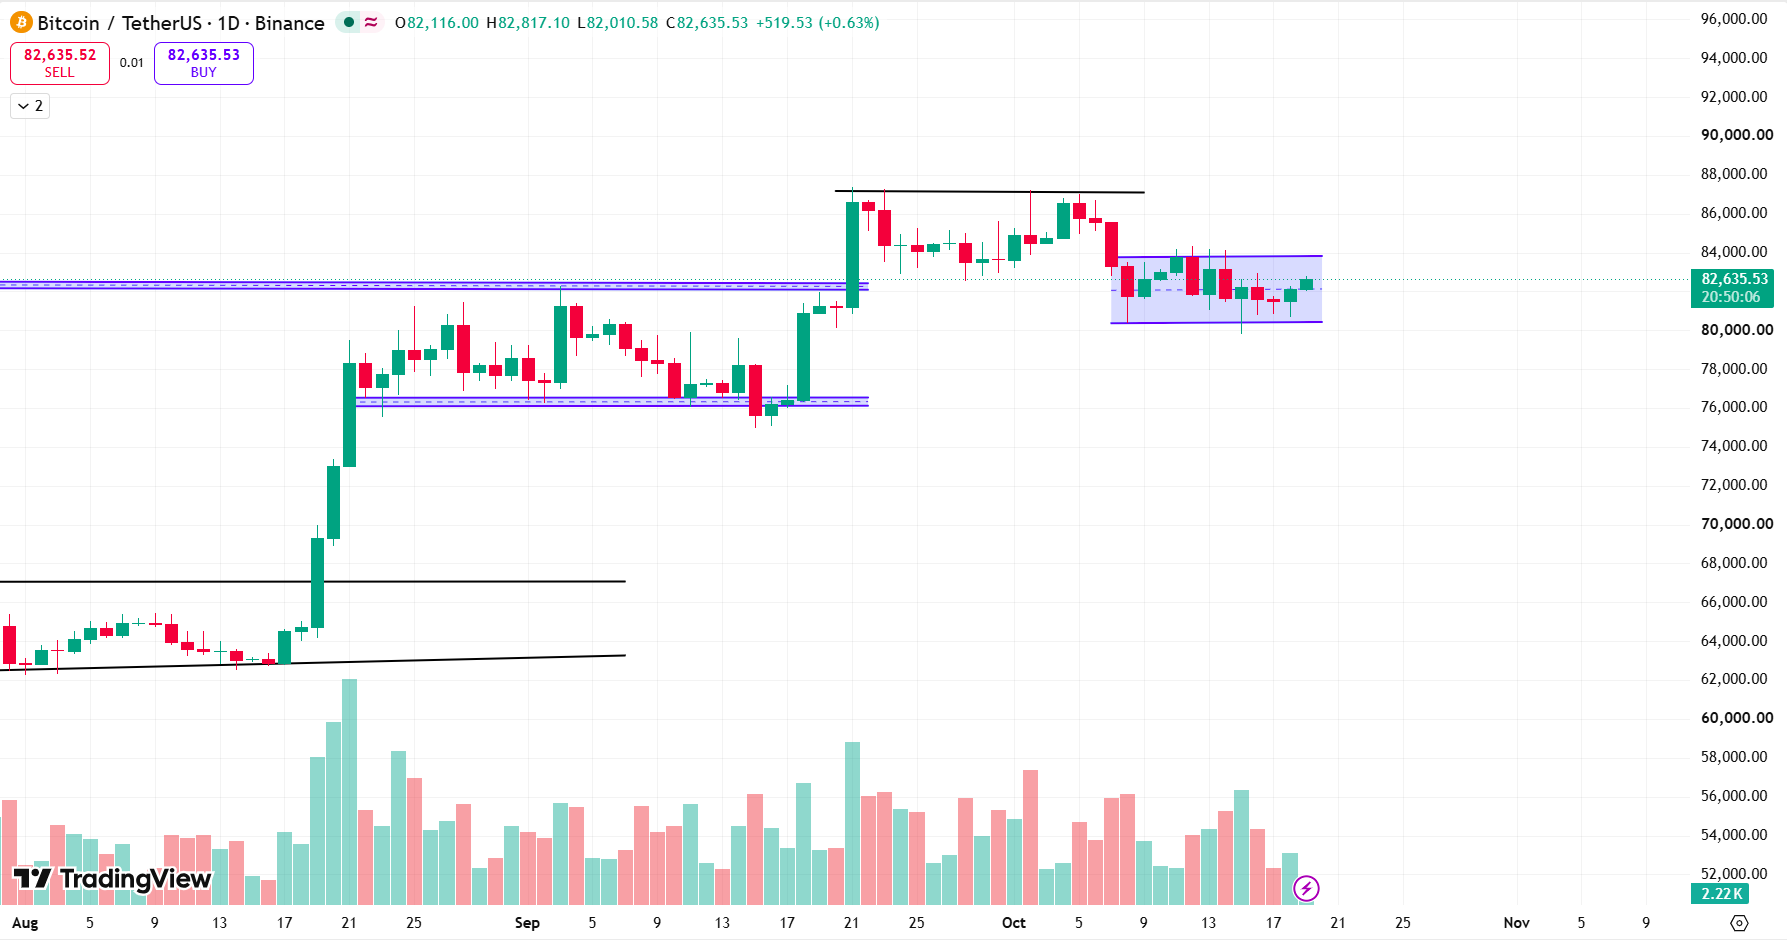
BTC/USDT is currently trading around $82,635 on the daily chart and is consolidating after a strong upward move from the $63,000–$65,000 region toward $87,000. After facing selling pressure near $87,000, the price has started moving sideways, indicating a temporary pause as buyers and sellers compete for control. The black horizontal line near $87,000 represents major resistance, while the blue zone between $80,300 and $84,000 marks the current trading range. The upper boundary near $84,000 is immediate resistance, and $80,300 is an important support level. If BTC breaks above $84,000, it could move toward $86,000–$87,000, whereas a breakdown below $80,300 could push the price toward $78,000–$76,000, where previous support is located.
The volume show that the earlier rally was supported by stronger trading activity, while volume has generally decreased during the recent sideways movement. This suggests that buying momentum has slowed and the market is waiting for a fresh move. A breakout above resistance accompanied by increasing green volume would strengthen the bullish outlook, while a breakdown below support with rising red volume could indicate stronger selling pressure. Overall, BTC is currently range-bound with a neutral short-term outlook and a slight bullish bias as long as $80,300 holds. The next significant move will likely depend on which side of the current range breaks with stronger volume.
Another important observation is that BTC recently faced rejection near $87,000 and has been forming smaller candles within the current range, suggesting indecision and a slowdown in price momentum. The repeated price reactions around $80,300 indicate that buyers are attempting to defend this support. However, the recent recovery toward $82,600 has not yet confirmed a strong bullish reversal. Traders should watch whether BTC starts forming higher lows, which could indicate that buying pressure is gradually increasing. If the price continues to struggle near $84,000, another retest of the lower support zone remains possible. A strong daily candle closing outside the current range, supported by higher volume, would provide a clearer signal of the next directional move.
Also Read: Top 5 Crypto Assets Traded in India in H1 2026
Key Levels:
| Support 2 | Support 1 | Asset | Resistance 1 | Resistance 2. |
| $75,000 | $80,300 | BTC | $83,900 | $87,000 |
Unravel everything that you need for your crypto journey via ZebPay blogs. Get started today and join 6 million+ registered users on ZebPay!