





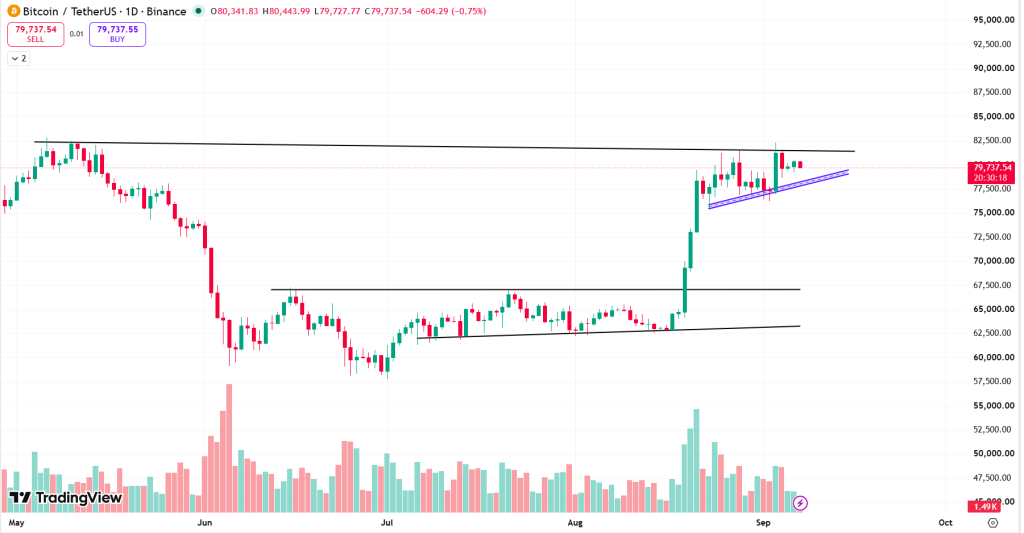
BTC is showing a bullish structure on the daily chart. After forming a major base around $58,000-$67,000, BTC broke above the $67,000 resistance with a strong expansion in price and volume. Following the breakout, BTC rallied sharply toward the $82,000-$83,000 resistance zone. Price has subsequently entered a consolidation phase while continuing to form higher lows along the rising trendline. The current structure resembles a bullish ascending consolidation/ascending-triangle type pattern. A confirmed breakout above the upper resistance with strong volume could signal further bullish continuation.
Technical Analysis
Bullish Breakout & Consolidation Formation
The chart clearly shows:
- Base: Major consolidation between approximately $58,000-$67,000.
- Breakout: Strong breakout above $67,000, supported by significant volume expansion.
- Impulse: BTC moved rapidly from around $67,000 to $82,000+.
- Consolidation: Price is currently consolidating around $77,000-$82,000.
- Higher lows: The rising blue trendline indicates that buyers are progressively defending higher levels.
- Volume: Volume was significantly higher during the breakout and has subsequently declined during consolidation, which can support a potential continuation setup.
Also Read: Chelsea FC and Circle Join Forces to Bring USDC to Football
Outlook
The daily chart maintains a bullish bias, with BTC consolidating near the upper end of its recent range. The $82,000-$83,000 resistance zone is the most important level to watch. A strong daily breakout above this zone, preferably accompanied by increasing volume, could confirm the continuation of the bullish structure and open the path toward $85,000 and $88,000-$90,000.
Using the current consolidation structure, an extended bullish move could potentially target the $95,000-$98,000 region. On the downside, a break below the $77,000-$78,000 rising trendline would indicate weakening momentum. A sustained move below $75,000 would further weaken the bullish setup and could bring $71,000-$72,000 into focus.
At the time of writing, BTC was trading at $79,725.
Summary
BTC remains bullish on the daily timeframe. The chart shows a strong breakout from the $58,000-$67,000 base, followed by an impulsive move toward $82,000-$83,000 and a higher-low consolidation pattern around $77,000-$82,000.
A strong daily breakout above $82,000-$83,000 could confirm bullish continuation toward $85,000, followed by $88,000-$90,000, with an extended target around $95,000-$98,000. The setup would weaken below $77,000-$78,000, while a break below $75,000 could lead to a deeper correction toward $71,000-$72,000.
Key Levels
| Support 2 | Support 1 | Asset | Resistance 1 | Resistance 2 |
| $75,000 | $77,500 | BTC | $82,500 | $85,000 |
Unravel everything that you need for your crypto journey via ZebPay blogs. Get started today and join 6 million+ registered users on ZebPay!