


BTC: Bitcoin is a decentralized digital asset launched in 2009 by the pseudonymous creator Satoshi Nakamoto. It operates without a central authority (no bank or government controls it) and enables peer-to-peer value transfer over the internet.
It was the first successful implementation of blockchain technology and remains the largest crypto asset by market capitalization. Bitcoin transactions are recorded on a public distributed ledger called the blockchain.
BTC has a market cap of $1.33 trillion as of date, while the total crypto market cap stands at $2.3 trillion. On the weekly chart, BTC witnessed a sharp fall from the $92,000-odd levels and hit a record low of $60,000 in the last 16 months.
The overall trend is still showing neutral to mildly negative momentum, as BTC is hitting consecutive lower lows, until we see a weekly bullish candle close.
Technical Chart of BTC
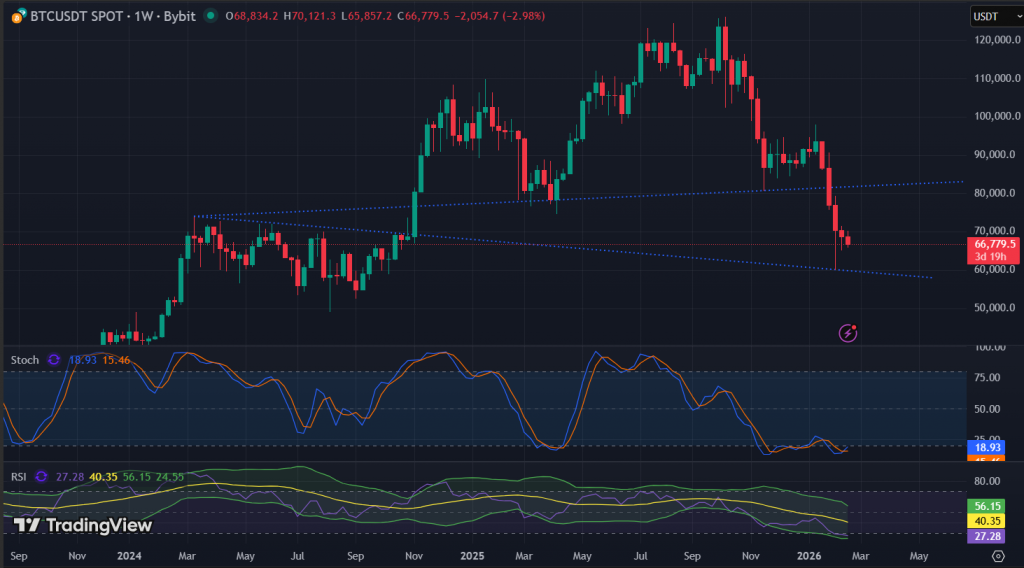
On the weekly chart, BTC price is trading below its Simple Moving Averages (14 & 21 periods) at levels of $91,112 and $93,218, indicating a small resistance in the coming sessions.
On the weekly chart, the Relative Strength Index (RSI) is at 27.28, and the Stochastic is at 18.93, indicating an oversold zone and a potential reversal.
Support and Resistance Levels
| Support 2 | Support 1 | Asset (Price) | Resistance 1 | Resistance 2 |
| $54,560 | $59,780 | BTC ($66,779.50) | $72,180 | $78,611 |
Above $78,611, there is a possibility of hitting $86,425 levels.
Unravel everything that you need for your crypto journey via ZebPay blogs. Get started today and join 6 million+ registered users on ZebPay!