





Here is a technical analysis of ETH/USDT on the daily timeframe:
Market Overview
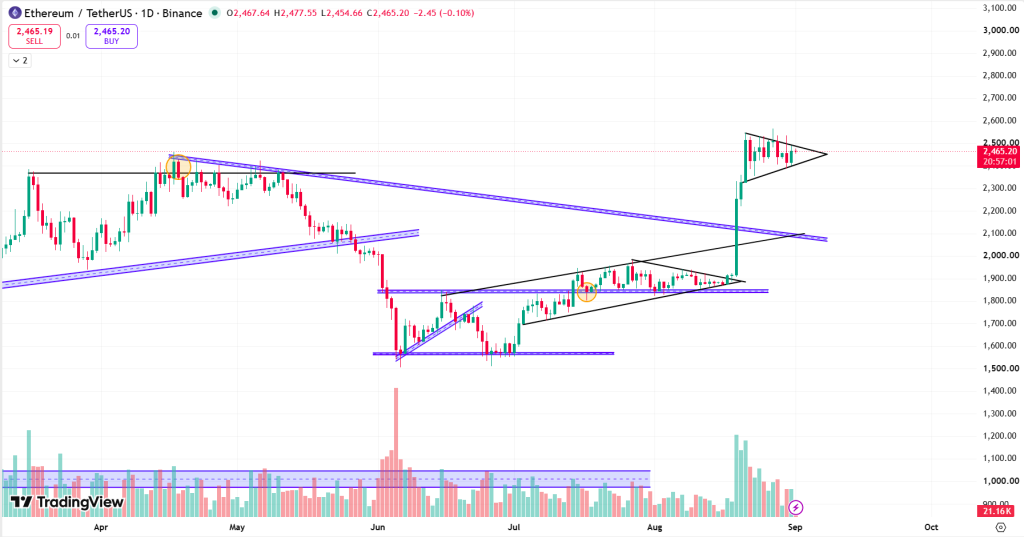
ETH is showing a strong bullish structure on the daily chart. After forming a major base around $1,550-$1,600, ETH recovered toward the $1,850 resistance and subsequently broke out strongly in August. The breakout was accompanied by a significant volume expansion, with ETH moving rapidly from around $1,900 to the $2,500-$2,550 region. Following this sharp upward move, the price has entered a consolidation phase, forming a Bull Flag-type structure. This is generally considered a bullish continuation setup when the price breaks above the upper boundary with strong volume.
Technical Analysis
Bull Flag & Pole Formation
The chart clearly shows:
- Pole: Strong upward move from approximately $1,850-$1,900 to $2,550.
- Flag: Short-term consolidation between approximately $2,350 and $2,550.
- The price is currently trading around $2,465, inside the flag.
- Volume increased sharply during the pole and has subsequently reduced during consolidation, which supports the continuation setup.
Also Read: Chelsea FC and Circle Join Forces to Bring USDC to Football
Key Levels
Resistance
- $2,500-$2,550: Upper flag resistance and key breakout zone
- $2,600: Immediate psychological resistance after the breakout
- $2,800-$3,000: Next major upside zone
- $3,100-$3,200: Potential extended target area
Support
- $2,350-$2,400: Immediate flag support
- $2,300: Secondary support
- $2,100: Major trendline/support area
- $1,850: Major previous breakout support
Outlook
The daily chart shows a strong pole followed by a flag consolidation, making the current structure favorable for a potential bullish continuation. The $2,550 breakout level is the most important level to watch. A confirmed breakout with strong volume could open the path toward $2,800-$3,000, with the measured flag-and-pole target extending toward approximately $3,150-$3,250.
At the time of writing, ETH was trading at approximately $2,465.
Summary
ETH remains bullish on the daily timeframe. The chart shows a strong bullish pole from $1,850 to $2,550, followed by a flag consolidation around $2,350-$2,550. A strong daily breakout above $2,550 could confirm continuation toward $2,800-$3,000, with a measured target around $3,150-$3,250. The setup would weaken below $2,350-$2,400, with $2,100 and $1,850 acting as major downside supports.
Support and Resistance Levels
| Support 2 | Support 1 | Asset | Resistance 1 | Resistance 2 |
| $2,150 | $2,350 | ETH | $2,550 | $2,800 |
In the grand scheme of things, ZebPay blogs are here to provide you with crypto wisdom. Get started today and join 6 million+ registered users to explore endless features on ZebPay!