

The crypto markets are fast-moving, and they are active 24*7. As market conditions evolve, traders are in constant search for no-fail moves that could make them profits. Investors developing strategies should also actively keep tabs on market movements; thus, technical analysis becomes an important method for investors and traders alike. Among the chart patterns used, the technical indicator ‘Head and Shoulders’ is considered one of the most important and reliable formations used in analyzing the markets for spotting a potential change in trend.
Introduction to Head and Shoulder Patterns
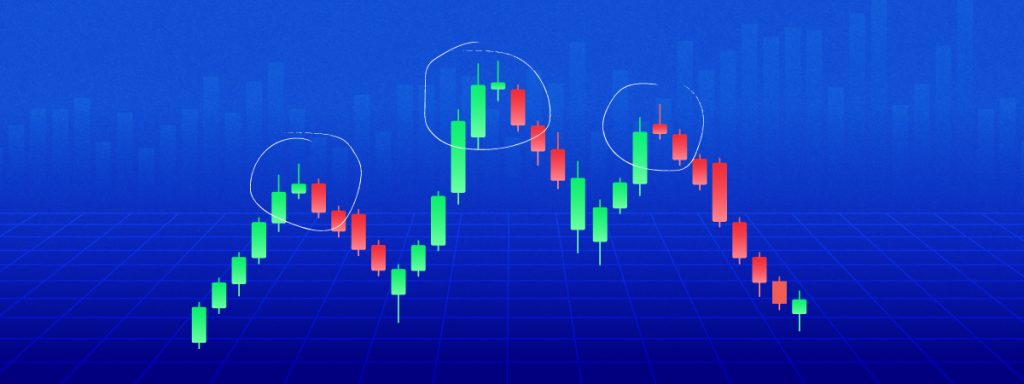
The price chart pattern Head and shoulder formation is a visually distinct and easy-to-recognize price formation that signals a potential change in market sentiment from bullish to bearish. It usually appears at the end of a period of up-trend in prices and consists of three major peaks: the larger middle peak that forms the ‘head’, and two slightly smaller peaks that form the shoulders, all joined by a horizontal line called the ‘neckline’ and considered an important support level.
Read more: What is a Head and Shoulder Pattern
How do I Draw a Head and Shoulder Pattern?
Let’s first explore the formation of the head and shoulders pattern, followed by its inverse counterpart.
Head and Shoulders pattern is typically observed at market tops.
- Left Shoulder: The price rises, reaches a peak, and then declines.
- Head: The price rises again, forming a higher peak.
- Right Shoulder: The price declines once more, then rises to form a peak lower than the head.
It’s important to note that these formations are rarely perfect, often exhibiting some variations or “noise” between the respective shoulders and heads.
Inverse Head and Shoulders Pattern (Typically Seen at Market Bottoms)
- Left Shoulder: The price declines, reaches a bottom, and then increases.
- Head: The price declines again, forming a lower bottom.
- Right Shoulder: The price increases once more, then declines to form a bottom higher than the head.
These patterns can be valuable indicators for identifying potential trend reversals in the market.
Read more: Can Chart Patterns Help with Crypto Trading
Step-by-Step Guide to Drawing Heads and Shoulders
The Head and Shoulders pattern can be spotted only by observing the smallest details on a price chart, and a trader needs to pay attention to each step of its formation: You should start with the identification of any uptrend if you spot the head and shoulders as a possible bearish reversal pattern. The pattern tends to form after a long-term uptrend. And if you can continue your observation, the steps become the following:
- Look for the Left Shoulder: Start by locating the first peak, known as the left shoulder. This peak should be followed by a minor price retracement, indicating a temporary pullback in the uptrend.
- Observe the Head: After the left shoulder, the price should rise to a higher peak, forming the head of the pattern. The head is crucial, representing the highest point reached during the uptrend, often coinciding with heightened buying activity.
- Identify the Right Shoulder: Following the head, the price should retrace, forming the right shoulder. This shoulder should be slightly lower than the left, creating a noticeable symmetry in the formation.
- Neckline: Connect the low points of the two shoulders to form the neckline. This horizontal support level is pivotal in validating the pattern’s completion.
Following these steps, traders can effectively identify the Head and Shoulders pattern, providing valuable insights into potential market reversals.
Confirming the Head and Shoulder Pattern’s Validity
The Head and Shoulders pattern exhibits a few key characteristics that traders need to keep in mind when identifying and confirming it:
- Symmetry: One critical aspect of this pattern is its symmetry. Traders love to see similarities in the height of the left and right shoulders, with the head being the highest. Ideally, the neckline should be flat or slightly slanted.
- Volume: Only looking at the volume confirms this pattern as the real thing. It’s often low when the price passes from the left shoulder through the head and rises again as the price forms the right shoulder. The increase in volume around the time the neckline is broken only adds further weight to the bearish signal.
- Neckline Break: The neckline acts as a crucial support level. A confirmed breach of this level signals the completion of the head and shoulders pattern. Traders often wait for the price to close below the neckline before considering potential short positions.
By paying attention to these characteristics, traders can more effectively identify and confirm the Head and Shoulders pattern, helping them make informed trading decisions.
Read more: How to Learn Technical Analysis
Avoiding Common Mistakes When Drawing the Head and Shoulder Pattern
Although popular among crypto investors, the Head and Shoulders chart pattern has its challenges.
Subjective Interpretation: This is a more objective pattern, as its value is generally trustworthy, but the interpretation of that value is more subjective and open to variation among traders, creating uncertainty and inconsistency, especially for less experienced traders.
The crypto market is volatile: Sometimes the market overrules the signal, such as head and shoulders, and could cause it to become unreliable.
False signals: A lot of people view it as a one-dimensional signal that will always trigger a trend reversal. The pattern itself does not always lead to a move in the reverse direction. If you use this pattern as a guide to buy or sell, and if the pattern completes and triggers a buy or sell signal, you will potentially lose a whole lot of money if the signal turns out to be a false one.
The difficulty for Novice Traders: The pattern can be succeeded, or even partially broken, without the price falling, a situation easily misinterpreted by a less experienced trader.
Reliance on Other Indicators: Typically, the Head and Shoulders pattern relies on corroboration by other indicators such as the RSI (Relative Strength Index) or the MACD (Moving Average Convergence/Divergence), with all signals not infrequently pointing in different directions.
Once these issues are understood, traders can treat the head and shoulders pattern as one potential clue among a bigger set of information that supports taking a measured approach to the market.
Read more: How To Use Moving Averages For Crypto Trading
Conclusion
The head and shoulders pattern is an important technical indicator that both beginners and advanced crypto investors follow closely to see how the crypto market moves. This pattern helps crypto investors because they learn more quickly from the development of market situations.
The head-and-shoulders pattern indicates that a change in market trends is occurring. However, a market reversal is not guaranteed. For this reason, crypto investors should never use the Head and Shoulders pattern in isolation; they should also use other technical indicators that can support better trading decisions in the crypto market. Other technical indicators to consider are the moving averages and the RSI (relative strength index).
If you found this blog useful, share it with other like-minded crypto enthusiasts. Click on the button below to begin your crypto trading journey using ZebPay.