




SOL has a market cap of $45.48 billion, as of today, while the total crypto market cap stands at $2.25 trillion:
- Morgan Stanley: Solana gains spot access through E*TRADE
- Solana tokenized asset trading volume reaches $5.77 billion in Q2
- Solana (SOL) ETFs boast an impressive $904 million in AUM
On the daily chart, Solana is currently trading around $78.10. The crypto market witnessed positive momentum yesterday, with SOL also finding support in the $73-75 zone. Positive news flow continues to build, while on-chain activity is also increasing. However, the chart continues to indicate resistance at the higher $84-87 levels.
Technical Chart of SOL
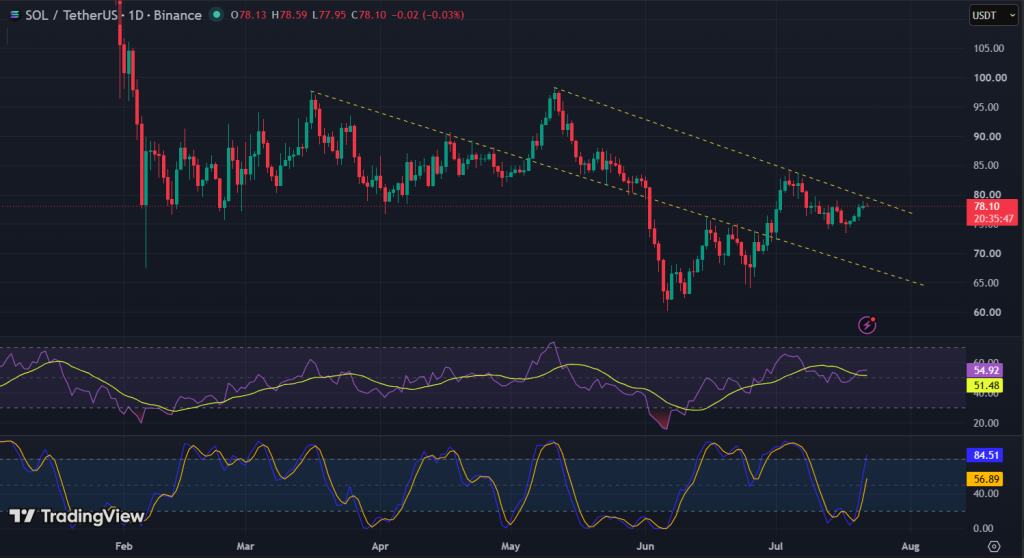
On the daily chart, SOL is trading above its 14-period and 21-period Simple Moving Averages at $76.59 and $76.53, respectively, indicating a supportive trend. On the daily chart, the RSI is at 54.92, remaining above the 50 mark and indicating improving bullish momentum. Meanwhile, the Stochastic Oscillator is at 84.51, reflecting an overbought condition. Overall, market sentiment has strengthened, but a decisive breakout above the key resistance levels is required to confirm further upside. In the near term, some profit booking may emerge at higher levels.
Also Read: Maharashtra Plans Blockchain Framework for Land Tokenisation
Support and Resistance Levels
| Support 2 | Support 1 | Asset (Price) | Resistance 1 | Resistance 2 |
| $73.70 | $68.05 | SOL ($78.10) | $82.35 | $87.15 |
Above $87.15, there’s a possibility of hitting the $91.30 levels.
In the grand scheme of things, ZebPay blogs are here to provide you with crypto wisdom. Get started today and join 6 million+ registered users to explore endless features on ZebPay!